SOCR MotionCharts
From Socr
(Difference between revisions)
(→Under Construction) |
|||
| (20 intermediate revisions not shown) | |||
| Line 1: | Line 1: | ||
== [[SOCR_EduMaterials_ChartsActivities |SOCR Charts Activities]] - SOCR Motion Charts == | == [[SOCR_EduMaterials_ChartsActivities |SOCR Charts Activities]] - SOCR Motion Charts == | ||
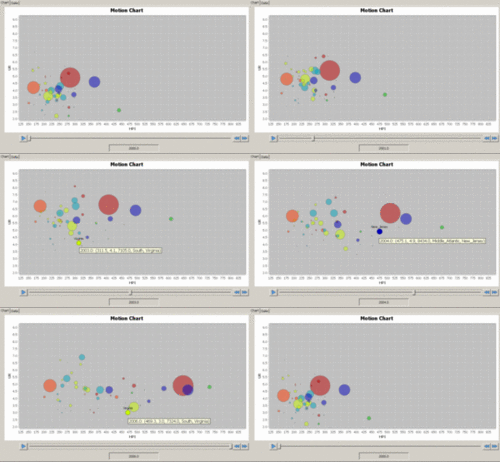
| + | [[Image:SOCR_Activities_MotionCharts_HPI_070109_Fig6_9_Animation.gif|250px|thumbnail|right| [http://www.socr.ucla.edu/SOCR_MotionCharts/ SOCR MotionCharts] ]] | ||
===Description=== | ===Description=== | ||
| - | + | [http://www.socr.ucla.edu/SOCR_MotionCharts/ SOCR Motion Charts] can be used to provide interactive and dynamic display of longitudinal or temporal [[SOCR Data]]. | |
| - | * [ | + | == Activities== |
| - | * | + | * [[SOCR_MotionCharts_HousingPriceIndex | MotionChart: Housing Price Index Activity]] |
| - | + | * [[SOCR_MotionCharts_CAOzoneData | MotionChart: California Ozone Data]] | |
| - | + | ||
| - | + | ||
| - | + | ||
| - | * [ | + | ==Under Construction== |
| - | * [[ | + | * [[SOCR MotionCharts_LAPopulation | MotionChart: LA Population Data Activity]] |
| + | * [[SOCR MotionCharts_Earthquakes | MotionChart: Earthquakes Data Activity]] | ||
| - | + | ===See also=== | |
| + | * [[SOCR_Videos_MotionCharts|Motion Charts Videos]] | ||
| + | * [http://www.gapminder.org/data/ Gapminder data] for motion charts (e.g., by country per capita income 1800-2015) | ||
| + | * [http://www.duckware.com/pmvr/howtoincreaseappletmemory.html Browser/Java memory usage] requirements: The [http://www.socr.ucla.edu/SOCR_MotionCharts/ SOCR MotionCharts] require at least 200MB of RAM memory. This requirement increases quadratically with the size of the data. | ||
| + | * [[About pages for SOCR Motion Charts]] | ||
| + | * [[Help pages for SOCR Motion Charts]] | ||
| + | * [[Google Motion Charts]] | ||
| + | * [[SOCR_Data | SOCR Datasets]] | ||
| + | * [[SOCR_MotionCharts_Test | Can these Motion Charts Work on Wiki pages?]] | ||
* [[SOCR_Videos_Charts | SOCR Charts Video Tutorial]] | * [[SOCR_Videos_Charts | SOCR Charts Video Tutorial]] | ||
* SOCR Home page: http://www.socr.ucla.edu | * SOCR Home page: http://www.socr.ucla.edu | ||
| + | |||
| + | ==References== | ||
| + | * Al-Aziz, J, Christou, N, Dinov, ID. (2010). [http://www.amstat.org/publications/jse/v18n3/dinov.pdf SOCR Motion Charts: An Efficient, Open-Source, Interactive and Dynamic Applet for Visualizing Longitudinal Multivariate Data], [http://www.amstat.org/publications/jse/contents_2010.htm JSE, 18(3)], 1-29. | ||
| + | * Dinov, ID, Christou, N. (2011) [http://www.informaworld.com/smpp/content%7Edb=all?content=10.1080/0020739X.2011.562315 Web-based tools for modelling and analysis of multivariate data: California ozone pollution activity], [http://www.informaworld.com/smpp/title%7Edb=all%7Econtent=t713736815 International Journal of Mathematical Education in Science and Technology (JMEST)], iFIRST:1-17, [http://www.informaworld.com/smpp/content%7Edb=all?content=10.1080/0020739X.2011.562315 DOI: 10.1080/0020739X.2011.562315]. | ||
{{translate|pageName=http://wiki.stat.ucla.edu/socr/index.php?title=SOCR_MotionCharts}} | {{translate|pageName=http://wiki.stat.ucla.edu/socr/index.php?title=SOCR_MotionCharts}} | ||
Current revision as of 05:44, 25 July 2011
Contents |
SOCR Charts Activities - SOCR Motion Charts
Description
SOCR Motion Charts can be used to provide interactive and dynamic display of longitudinal or temporal SOCR Data.
Activities
Under Construction
See also
- Motion Charts Videos
- Gapminder data for motion charts (e.g., by country per capita income 1800-2015)
- Browser/Java memory usage requirements: The SOCR MotionCharts require at least 200MB of RAM memory. This requirement increases quadratically with the size of the data.
- About pages for SOCR Motion Charts
- Help pages for SOCR Motion Charts
- Google Motion Charts
- SOCR Datasets
- Can these Motion Charts Work on Wiki pages?
- SOCR Charts Video Tutorial
- SOCR Home page: http://www.socr.ucla.edu
References
- Al-Aziz, J, Christou, N, Dinov, ID. (2010). SOCR Motion Charts: An Efficient, Open-Source, Interactive and Dynamic Applet for Visualizing Longitudinal Multivariate Data, JSE, 18(3), 1-29.
- Dinov, ID, Christou, N. (2011) Web-based tools for modelling and analysis of multivariate data: California ozone pollution activity, International Journal of Mathematical Education in Science and Technology (JMEST), iFIRST:1-17, DOI: 10.1080/0020739X.2011.562315.
Translate this page:

