AP Statistics Curriculum 2007 Distrib Multinomial
From Socr
(→SOCR Multinomial Examples) |
(→SOCR Multinomial Examples) |
||
| Line 69: | Line 69: | ||
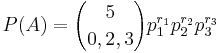
: <math>P(A) =</math> | : <math>P(A) =</math> | ||
| - | However, we can also find a pretty close empirically-driven estimate using the [[ | + | However, we can also find a pretty close empirically-driven estimate using the [[SOCR_EduMaterials_Activities_DiceExperiment | SOCR Dice Experiment]]. |
| - | For instance, running the [http://socr.ucla.edu/htmls/SOCR_Experiments.html SOCR Dice | + | For instance, running the [http://socr.ucla.edu/htmls/SOCR_Experiments.html SOCR Dice Experiment] 1,000 times with number of dice n=10, and the loading probabilities listed above, we get an output like the one shown below. |
<center>[[Image:SOCR_EBook_Dinov_Multinimial_030508_Fig1.jpg|500px]]</center> | <center>[[Image:SOCR_EBook_Dinov_Multinimial_030508_Fig1.jpg|500px]]</center> | ||
Revision as of 07:40, 6 March 2008
Contents |
General Advance-Placement (AP) Statistics Curriculum - Multinomial Random Variables and Experiments
The multinomial experiments (and multinomial distribtuions) directly extend the their bi-nomial counterparts.
Multinomial experiments
A multinomial experiment is an experiment that has the following properties:
- The experiment consists of k repeated trials.
- Each trial has a discrete number of possible outcomes.
- On any given trial, the probability that a particular outcome will occur is constant.
- The trials are independent; that is, the outcome on one trial does not affect the outcome on other trials.
Examples of Multinomial experiments
- Suppose we have an urn containing 9 marbles. Two are red, three are green, and four are blue (2+3+4=9). We randomly select 5 marbles from the urn, with replacement. What is the probability (P(A)) of the event A={selecting 2 green marbles and 3 blue marbles}?
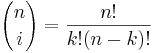
- To solve this problem, we apply the multinomial formula. We know the following:
- The experiment consists of 5 trials, so k = 5.
- The 5 trials produce 0 red, 2 green marbles, and 3 blue marbles; so r1 = rred = 0, r2 = rgreen = 2, and r3 = rblue = 3.
- For any particular trial, the probability of drawing a red, green, or blue marble is 2/9, 3/9, and 5/9, respectively. Hence, p1 = pred = 2 / 9, p2 = pgreen = 1 / 3, and p3 = pblue = 5 / 9.
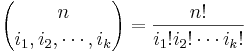
Plugging these values into the multinomial formula we get the probability of the event of interest to be:

Thus, if we draw 5 marbles with replacement from the urn, the probability of drawing no red , 2 green, and 3 blue marbles is 0.19052.
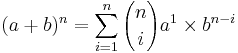
Synergies between Binomial and Multinomial processes/probabilities/coefficients
- The Binomial vs. Multinomial Coefficients (See this Binomial Calculator)
- The Binomial vs. Multinomial Formulas

- The Binomial vs. Multinomial Probabilities (See this Binomial distribution calculator)

Example
Suppose we study N independent trials with results falling in one of k possible categories labeled 1,2,cdots,k. Let pi be the probability of a trial resulting in the ith category, where  . Let Ni be the number of trials resulting in the ith category, where
  .
.
For instance, suppose we have 9 people arriving at a meeting according to the following information:
- P(by Air) = 0.4, P(by Bus) = 0.2, P(by Automobile) = 0.3, P(by Train) = 0.1
- Compute the following probabilities
- P(3 by Air, 3 by Bus, 1 by Auto, 2 by Train) = ?
- P(2 by air) = ?
SOCR Multinomial Examples
Suppose we row 10 loaded hexagonal (6-face) dice 8 times and we are interested in the probability of observing the event A={3 ones, 3 twos, 2 threes, and 2 fours}. Assume the dice are loaded to the small outcomes according to the following probabilities of the 6 outcomes (one is the most likely and six is the least likely outcome).
| x | 1 | 2 | 3 | 4 | 5 | 6 |
| P(X=x) | 0.286 | 0.238 | 0.19 | 0.143 | 0.095 | 0.048 |
- P(A)=?
Of course, we can compute this number exactly as:
- P(A) =
However, we can also find a pretty close empirically-driven estimate using the SOCR Dice Experiment.
For instance, running the SOCR Dice Experiment 1,000 times with number of dice n=10, and the loading probabilities listed above, we get an output like the one shown below.

Now, we can actually count how many of these 1,000 trials generated the event A as an outcome. In this one experiment of 1,000 trials there were 8 outcomes of the type {3 ones, 3 twos, 2 threes and 2 fours}. Therefore, the relative proportion of these outcomes to 1,000 will give us a fairly accurate estimate of the exact probability we computed above
-
 .
.
References
- SOCR Home page: http://www.socr.ucla.edu
Translate this page:
