LearningActivities ColorBlindness
From Socr
Contents |
Distributome Learning Activities - Distributome Colorblindness Activity
A 1996 poll of 1,200 African American adults found that 708 think that the American dream has become impossible to achieve. The New Yorker magazine editors want to estimate the proportion of all African American adults who feel this way. Which of the following is an approximate 90% confidence interval for the proportion of all African American adults who feel this way?
- Choose one answer.
- (a) (.56, .62)
- (b) (.57, .61)
- (c) Can't be calculated because the population size is too small.
- (d) Can't be calculated because the sample size is too small.
Overview
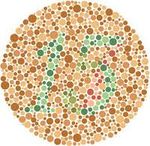
This Distributome Activity illustrates an application of probability theory to study Colorblindness.
Colorblindness results from an abnormality on the X chromosome. The condition is thus rarer in women since a woman would need to have the abnormality on both of her X chromosomes in order to be colorblind (whether a woman has the abnormality on one X chromosome is essentially independent of having it on the other).
Goals
The goal of this activity is to demonstrate an efficient protocol of estimating the probability that a randomly chosen individual may be colorblind.
Hands-on Activity
Suppose that p is the probability that a randomly selected man is colorblind.
- 100 men are selected at random. What is the distribution of Xm = the number of these men that are colorblind?
- Xm~Binomial(100,p).
- 100 women are selected at random. What is the distribution of Xf = the number of these women that are colorblind?
- Hint: the chance that an individual woman is colorblind is p2, why?
- Solution: Xf~Binomial(100,p2)
- To estimate the probability that a randomly selected woman is colorblind, you might use the proportion of colorblind women in a sample of n women. What is the variance of this estimator?
- Xf~Binomial(n,p2). Thus
 .
.
- Xf~Binomial(n,p2). Thus
- Alternatively, to estimate the probability that a randomly selected woman is colorblind, you might use the square of the proportion of colorblind men in a sample of n men. Explain why this estimate makes sense. What is the variance of this estimator?
- Hint: The moment generating function can be used to find the fourth moment about the origin.
- Hint: We want to estimate p2 and
 estimates p so it makes sense to use
  as the estimator (in fact it will be the maximum likelihood estimate). We have
 ![Var[( \frac{X_m}{n} )^2 ] = n^{-4}[E(X_m^4 ) - (E(X_m^2 ))^2 ]](/distributome/uploads/math/7/b/1/7b1d064eb834c54f5fa75fccf0b68fa6.png) . Take q = 1 − p. Then the fourth moment about the origin of a binomial is E(X4) = np(q − 6pq2 + 7npq − 11np2q + 6n2p2q + n3p3) and the second moment is E(X2) = np(q + np). Thus
. Take q = 1 − p. Then the fourth moment about the origin of a binomial is E(X4) = np(q − 6pq2 + 7npq − 11np2q + 6n2p2q + n3p3) and the second moment is E(X2) = np(q + np). Thus ![Var[( \frac{X_m}{n} )^2 ] = n^{-3}(pq + 6(n-1)p^2q^2 + 4n(n-1)p^3q)](/distributome/uploads/math/a/7/5/a758430bad27ccec1ecba7e928df8764.png) .
.
- For large samples, is it better to use a sample of men or a sample of women to estimate the probability that a randomly selected women is colorblind? Explain.
- Hint: Show that a normal approximation is valid for both and then compare the variances.
- Solution: For large n the ratio of the variances for the estimate in part c to the estimate in part d is
 . When this ratio is greater than 1, the estimator based on the sample of men will be better. Since this happens for any
  , which is clearly the case for colorblindness, it is better to use a sample of men to estimate the probability that a random woman is colorblind.
- Solution: For large n the ratio of the variances for the estimate in part c to the estimate in part d is
Conclusions
You can also use the delta method to find the approximate variance for the estimator above.
Translate this page:

