AP Statistics Curriculum 2007 Pareto
From Socr
(→Pareto Distribution) |
|||
| Line 1: | Line 1: | ||
| + | ==[[AP_Statistics_Curriculum_2007 | General Advance-Placement (AP) Statistics Curriculum]] - Pareto Distribution== | ||
| + | |||
===Pareto Distribution=== | ===Pareto Distribution=== | ||
'''Definition''': Pareto distribution is a skewed, heavy-tailed distribution that is sometimes used to model that distribution of incomes. The basis of the distribution is that a high proportion of a population has low income while only a few people have very high incomes. | '''Definition''': Pareto distribution is a skewed, heavy-tailed distribution that is sometimes used to model that distribution of incomes. The basis of the distribution is that a high proportion of a population has low income while only a few people have very high incomes. | ||
| Line 58: | Line 60: | ||
The figure below shows this result using [http://socr.ucla.edu/htmls/dist/Pareto_Distribution.html SOCR distributions] | The figure below shows this result using [http://socr.ucla.edu/htmls/dist/Pareto_Distribution.html SOCR distributions] | ||
<center>[[Image:Pareto.jpg|600px]]</center> | <center>[[Image:Pareto.jpg|600px]]</center> | ||
| + | |||
| + | <hr> | ||
| + | * SOCR Home page: http://www.socr.ucla.edu | ||
| + | |||
| + | {{translate|pageName=http://wiki.stat.ucla.edu/socr/index.php/AP_Statistics_Curriculum_2007_Chi-Square}} | ||
Revision as of 22:34, 18 July 2011
Contents |
General Advance-Placement (AP) Statistics Curriculum - Pareto Distribution
Pareto Distribution
Definition: Pareto distribution is a skewed, heavy-tailed distribution that is sometimes used to model that distribution of incomes. The basis of the distribution is that a high proportion of a population has low income while only a few people have very high incomes.
Probability density function: For 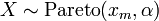 , the Pareto probability density function is given by

where
- xm is the minimum possible value of X
- α is a positive parameter which determines the concentration of data towards the mode
- x is a random variable (x > xm)
Cumulative density function: The Pareto cumulative distribution function is given by

where
- xm is the minimum possible value of X
- α is a positive parameter which determines the concentration of data towards the mode
- x is a random variable (x > xm)
Moment generating function: The Pareto moment-generating function is

where

Expectation: The expected value of Pareto distributed random variable x is
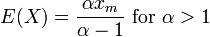
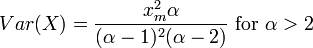
Variance: The Pareto variance is
Applications
The Pareto distribution is sometimes expressed more simply as the “80-20 rule”, which describes a range of situations. In customer support, it means that 80% of problems come from 20% of customers. In economics, it means 80% of the wealth is controlled by 20% of the population. Examples of events that may be modeled by Pareto distribution include:
- The sizes of human settlements (few cities, many villages)
- The file size distribution of Internet traffic which uses the TCP protocol (few larger files, many smaller files)
- Hard disk drive error rates
- The values of oil reserves in oil fields (few large fields, many small fields)
- The length distribution in jobs assigned supercomputers (few large ones, many small ones)
- The standardized price returns on individual stocks
- The sizes of sand particles
- The sizes of meteorites
- The number of species per genus
- The areas burned in forest fires
- The severity of large casualty losses for certain businesses, such as general liability, commercial auto, and workers compensation
Example
Suppose that the income of a certain population has a Pareto distribution with α = 3 and xm = 1000. Compute the proportion of the population with incomes between 2000 and 4000.
We can compute this as follows:
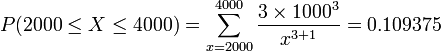
The figure below shows this result using SOCR distributions

- SOCR Home page: http://www.socr.ucla.edu
Translate this page:
