SOCR EduMaterials Activities ExpDist
From Socr
(Difference between revisions)
| Line 14: | Line 14: | ||
* Find the height of the density at 3 values of <math>X</math> (one near 0, one near the mean, and one towards the tail of the distribution). | * Find the height of the density at 3 values of <math>X</math> (one near 0, one near the mean, and one towards the tail of the distribution). | ||
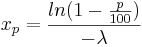
| - | * Find one percentile for each of these distributions and record them on the printouts. Verify these percentiles using the formula we discussed in class: | + | * Find one percentile for each of these distributions and record them on the printouts. Verify these percentiles using the formula we discussed in class: <math>x_p=\frac{ln(1-\frac{p}{100})}{-\lambda}</math> |
| - | <math> | + | |
| - | * Compute one cumulative probability for each one of these distributions, show it on the graph, and verify it with the formula: | + | * Compute one cumulative probability for each one of these distributions, show it on the graph, and verify it with the formula: <math>P(X \le x)=1-e^{-\lambda x}</math> |
| - | <math> | + | |
* Graph and print | * Graph and print | ||
Current revision as of 17:15, 12 June 2007
Contents |
This is an activity to explore the Exponential Distribution: Learn how to compute probabilities, densities, and percentiles
Description
You can access the applet for the Exponential Distributions
- Graph and print
- Locate the maximum density for each one of these distributions.
- Find the height of the density at 3 values of X (one near 0, one near the mean, and one towards the tail of the distribution).
- Find one percentile for each of these distributions and record them on the printouts. Verify these percentiles using the formula we discussed in class:
- Compute one cumulative probability for each one of these distributions, show it on the graph, and verify it with the formula:
- Graph and print
-
- Find one percentile for each one of these distributions and locate them on the printouts.
- Find one cumulative probability for each one of these distributions and locate them on the printouts.
Exercise 1
Construct the joint probability distribution of X and Y.
Exercise 2
Find the conditional expected value of Y given X=5.
Exercise 3
Find the conditional variance of Y given X=5.
Exercise 4
Find the expected value of Y.
Exercise 5
Find the standard deviation of Y.
Exercise 6
Graph the probability distribution of Y.
Exercise 7
Use SOCR Experiments and choose "Die Coin Experiment" to graph and print the empirical distribution of Y when the experiment is performed:
- n = 1000 times.
- n= 10000 times

Exercise 8
Compare the theoretical mean and standard deviation of Y (exercise 4 and 5) with the empirical mean and standard deviation found in exercise 7.
- SOCR Home page: http://www.socr.ucla.edu
Translate this page:
