SOCR EduMaterials Activities Exponential Distribution
From Socr
(Difference between revisions)
m (→This is an activity to explore the Exponential Distribution: Learn how to compute probabilities, densities, and percentiles.) |
|||
| Line 10: | Line 10: | ||
* '''Exercise 1:''' Graph and print: | * '''Exercise 1:''' Graph and print: | ||
| - | a. exp(0.2) | + | **a. exp(0.2) |
| - | + | **b. exp(1) | |
| - | b. exp(1) | + | **c. exp(10) |
| - | + | ||
| - | c. exp(10) | + | |
* '''Exercise 2:''' Locate the maximum density for each one of these distributions. | * '''Exercise 2:''' Locate the maximum density for each one of these distributions. | ||
Current revision as of 18:55, 8 July 2007
This is an activity to explore the Exponential Distribution: Learn how to compute probabilities, densities, and percentiles.
- Description: You can access the applet for the Exponential Distributions
- Here is the shape of the exponential distribution (this is a snpashot from the SOCR website):

- Exercise 1: Graph and print:
- a. exp(0.2)
- b. exp(1)
- c. exp(10)
- Exercise 2: Locate the maximum density for each one of these distributions.
- Exercise 3: Find the height of the density at 3 values of X (one near 0, one near the mean, and one towards the tail of the distribution).
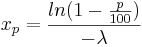
- Exercise 4: Find one percentile for each of these distributions and record them on the printouts. Verify these percentiles using the formula we discussed in class:
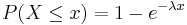
- Exercise 5: Compute one cumulative probability for each one of these distributions, show it on the graph, and verify it with the formula:
- SOCR Home page: http://www.socr.ucla.edu
Translate this page:
