AP Statistics Curriculum 2007 Gamma
From Socr
Gamma Distribution
Definition: Gamma distribution is a distribution that arises naturally in processes for which the waiting times between events are relevant. It can be thought of as a waiting time between Poisson distributed events.
Probability density function: The waiting time until the hth Poisson event with a rate of change λ is
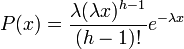
For 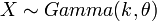 , where k = h and θ = 1 / λ, the gamma probability density function is given by

where
- e is the natural number (e = 2.71828…)
- k is the number of occurrences of an event
- if k is a positive integer, then Γ(k) = (k − 1)! is the gamma function
- θ = 1 / λ is the mean number of events per time unit, where λ is the mean time between events. For example, if the mean time between phone calls is 2 hours, then you would use a gamma distribution with θ=1/2=0.5. If we want to find the mean number of calls in 5 hours, it would be 5
 1/2=2.5.
- x is a random variable
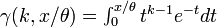
Cumulative density function: The gamma cumulative distribution function is given by

where
- if k is a positive integer, then Γ(k) = (k − 1)! is the gamma function
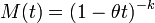
Moment generating function: The gamma moment-generating function is
Expectation: The expected value of a gamma distributed random variable x is

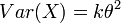
Variance: The gamma variance is
Applications
The gamma distribution can be used a range of disciplines including queuing models, climatology, and financial services. Examples of events that may be modeled by gamma distribution include:
- The amount of rainfall accumulated in a reservoir
- The size of loan defaults or aggregate insurance claims
- The flow of items through manufacturing and distribution processes
- The load on web servers
- The many and varied forms of telecom exchange
The gamma distribution is also used to model errors in a multi-level Poisson regression model because the combination of a Poisson distribution and a gamma distribution is a negative binomial distribution.
Example
Suppose you are fishing and you expect to get a fish once every 1/2 hour. Compute the probability that you will have to wait between 2 to 4 hours before you catch 4 fish.
One fish every 1/2 hour means we would expect to get θ = 1 / 0.5 = 2 fish every hour on average. Using θ = 2 and k = 4, we can compute this as follows:
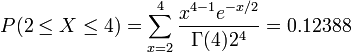
The figure below shows this result using SOCR distributions

