SOCR EduMaterials Activities ApplicationsActivities StockSimulation
From Socr
A Model for Stock prices
- Description: You can access the stock simulation applet at http://www.socr.ucla.edu/htmls/app/ .
- Process for Stock Prices: Assumed a drift rate equal to μS where μ is the expected return of the stock, and variance σ2S2 where σ2 is the variance of the return of the stock. From Weiner process the model for stock prices is:
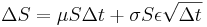 or
or
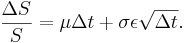 Therefore

S Price of the stock.
ΔS Change in the stock price.
Δt Small interval of time.
ε Follows N(0,1).
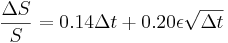
- Example: The current price of a stock is
 . The expected return is μ = 0.10 per year, and the standard deviation of the return is σ = 0.20 (also per year).
- Find an expression for the process of the stock.
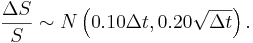
- Find the distribution of the change in
 .
.
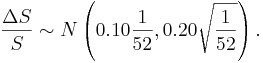
- Divide the year in weekly intervals and find the distribution of
 at the end of each weekly interval.
- Therefore, sampling from this distribution we can simulate the path of the stock. The price of the stock at the end of the first interval will be S1 = S0 + ΔS1, where ΔS1 is the change during the first time interval, etc.
- Using the SOCR applet we will simulate the stock's path by dividing one year into small intervals each one of length
 of a year, when
  .
.
- The applet will select a random sample of 100 observations from N(0,1) and will compute
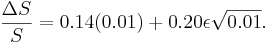 Suppose that ε1 = 0.58. Then

Therefore
ΔS1 = S0 + ΔS1 = 20 + 0.26 = 20.26.
We continue in the same fashion until we reach the end of the year.

