AP Statistics Curriculum 2007 Chi-Square
From Socr
| Line 167: | Line 167: | ||
* SOCR Home page: http://www.socr.ucla.edu | * SOCR Home page: http://www.socr.ucla.edu | ||
| - | {{translate|pageName=http://wiki.stat.ucla.edu/socr/index.php/ | + | {{translate|pageName=http://wiki.stat.ucla.edu/socr/index.php/AP_Statistics_Curriculum_2007_Chi-Square}} |
Revision as of 20:16, 2 July 2011
Contents |
General Advance-Placement (AP) Statistics Curriculum - Chi-Square Distribution
Chi-Square Distribution
The Chi-Square distribution is used in the chi-square tests for goodness of fit of an observed distribution to a theoretical one and the independence of two criteria of classification of qualitative data. It is also used in confidence interval estimation for a population standard deviation of a normal distribution from a sample standard deviation. The Chi-Square distribution is a special case of the Gamma distribution [link to gamma].
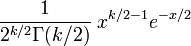
PDF:
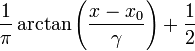
CDF:
Mean:
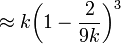
Median:
Mode:
max{ k − 2, 0 }
Variance:
2k
Support:
x ∈ [0, +∞)
1st Moment:
k
2nd Moment:
2k
Applications
 Independence of two criteria of classification of qualitative data
Confidence Interval estimation for a population standard deviation of a normal distribution from a sample standard deviation
ANOVA: The F distribution is distribution of two independent chi-square random variables, divided by their respective degrees of freedom [link to Fisher’s F, ANOVA]
Example
Chi Square Test for Goodness of Fit: There are 60 people in a statistics class, and we have data on the month of their birth. Our null hypothesis is that the number of students with a particular birth month should be divided equally among the total 60. We can use a chi square test with 12-1=11 degrees of freedom to compare the observed data against our null hypothesis.
| Birthday Month | Observed | Expected | Residual (Obs-Exp) | (Obs − Exp)2 | (Obs − Exp)2 / Exp |
|---|---|---|---|---|---|
| Jan | 3 | 5 | -2 | 4 | 0.8 |
| Feb | 4 | 5 | -1 | 1 | 0.2 |
| Mar | 8 | 5 | 3 | 9 | 1.8 |
| April | 4 | 5 | -1 | 1 | 0.2 |
| May | 2 | 5 | -3 | 9 | 1.8 |
| June | 3 | 5 | -2 | 4 | 0.8 |
| July | 6 | 5 | 1 | 1 | 0.2 |
| Aug | 6 | 5 | 1 | 1 | 0.2 |
| Sept | 4 | 5 | -1 | 1 | 0.2 |
| Oct | 3 | 5 | -2 | 4 | 0.8 |
| Nov | 2 | 5 | -3 | 9 | 1.8 |
| Dec | 5 | 5 | 0 | 0 | 0 |
| Total = | 8.8 |
Our Chi Square value is 8.8. Using the SOCR Chi-Square Distribution Calculator, at 11 degrees of freedom, a chi square value of 8.8 gives us a p-value of 0.36. We do not reject our null hypothesis. The observed data do not show evidence of a non-uniform distribution of birth months.

SOCR Links
http://www.distributome.org/ -> SOCR -> Distributions -> Distributome
http://www.distributome.org/ -> SOCR -> Distributions -> Chi-Square Distribution
http://www.distributome.org/ -> SOCR -> Functors -> Chi-Square Distribution
http://www.distributome.org/ -> SOCR -> Analyses -> Chi-Square Test Contingency Table
http://www.distributome.org/ -> SOCR -> Analyses -> Chi-Square Model Goodness-of-Fit Test
http://www.distributome.org/ -> SOCR -> Modeler -> ChiSquareFit_Modeler
SOCR Chi-Square Distribution Calculator (http://socr.ucla.edu/htmls/dist/ChiSquare_Distribution.html)
- SOCR Home page: http://www.socr.ucla.edu
Translate this page:
