AP Statistics Curriculum 2007 Distrib Binomial
From Socr
| Line 27: | Line 27: | ||
|} | |} | ||
</center> | </center> | ||
| + | |||
| + | <center>[[Image:SOCR_EBook_Dinov_RV_Binomial_013008_Fig1.jpg|400px]]</center> | ||
* Suppose 10% of the human population carries the green-eye alial. If we choose 1,000 people randomly and let the RV X be the number of green-eyed people in the sample. Then the distribution of X is binomial distribution with n = 1,000 and p = 0.1 (denoted as <math>X \sim B(1,000, 0.1)</math>. | * Suppose 10% of the human population carries the green-eye alial. If we choose 1,000 people randomly and let the RV X be the number of green-eyed people in the sample. Then the distribution of X is binomial distribution with n = 1,000 and p = 0.1 (denoted as <math>X \sim B(1,000, 0.1)</math>. | ||
| - | === | + | ===Binomial Modeling=== |
| - | + | ====Exact Binomila Model==== | |
| + | The Binomial distribution (i.e., biased-coin tossing experiment) is an exact physical model for any experiment which can be characterized as a series of trials where: | ||
| + | * Each trial has only two outcomes: success or failure; | ||
| + | * P(success)=p is the same for every trial; and | ||
| + | * Trials are independent. | ||
| + | |||
| + | ====Approximate Binomial Model==== | ||
| + | If we observe an experiment comprized of n identical trials involving a large population (of size N). Suppose the population contains a sub-population of subjects that have a characteristic of interest and the sub-population proportion is p (0<p<1). Then the distribution of X={the number of outcomes in the sample with that characteristic of interest}, is approximately Binomial(n, p). This approximation is adequate if the ratio n/N < 0.05. | ||
| + | |||
| + | * Example: Polling the US population to see what proportion is/has-been married. Because we sample without replacement (can't ask the same individual twice), the second assumption of the (exact) Binomial model is (slightly) violated. Yet, the small ration of sample to population size yields that the Binomial model is approximately valid (i.e., the proportion of subjects that is/has-been married does not change significantly as we poll one subject, and therefore remove him/her from the complete pool of subjects we poll). | ||
| + | |||
| + | ===Binomial Probabilities=== | ||
| + | If the random variable ''X'' follows the Binomial distribution with (fixed) parameters ''n'' (sample-size) and ''p'' (probability of success at one trial), we write ''X'' ~ B(''n'', ''p''). The probability of getting exactly ''x'' successes is given by the Binomila probability (or mass) function: <math>P(X=x)={n\choose k}p^k(1-p)^{n-k}</math>, for ''x'' = 0, 1, 2, ..., ''n'', where <math>{n\choose k}=\frac{n!}{k!(n-k)!}</math> is the binomial coefficient. | ||
| + | |||
| + | This probability expression has an easy and intuitive interpretation. The probability of the ''x'' successes in the ''n'' trials is (''p''<sup>''x''</sup>). Similarly, the probability of the ''n-x'' failures is (1 − ''p'')<sup>''n-x''</sup>. However, the ''x'' successes can be [[AP_Statistics_Curriculum_2007_Prob_Count | arranged]] anywhere among the ''n'' trials, and there are <math>{n\choose k}=\frac{n!}{k!(n-k)!}</math> different ways of arranging the ''x'' successes in a sequence of ''n'' trials, see the [[AP_Statistics_Curriculum_2007_Prob_Count |Counting section]]. | ||
| - | |||
===Model Validation=== | ===Model Validation=== | ||
Revision as of 20:05, 30 January 2008
Contents
|
General Advance-Placement (AP) Statistics Curriculum - Bernoulli and Binomial Random Variables and Experiments
Bernoulli process
A Bernoulli trial is an experiment whose dichotomous outcomes are random (e.g., "success" vs. "failure", "head" vs. "tail", +/-, "yes" vs. "no", etc.) Most common notations of the outcomes of a Bernoulli process are success and failure, even though these outcome labels should not be construed literally.
- Examples of Bernoulli trials
- A Coin Toss. We can obverse H="heads", conventionally denoted success, or T="tails" denoted as failure. A fair coin has the probability of success 0.5 by definition.
- Rolling a Die: Where the outcome space is binarized to "success"={6} and "failure" = {1, 2, 3, 4, 5}.
- Polls: Choosing a voter at random to ascertain whether that voter will vote "yes" in an upcoming referendum.
- The Bernoulli random variable (RV): Mathematically, a Bernoulli trial is modeled by a random variable
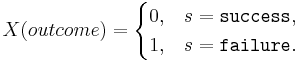 If p=P(success), then the expected value of X, E[X]=p and the standard deviation of X, SD[X] is
  .
.
- A Bernoulli process consists of repeatedly performing independent but identical Bernoulli trials.
Binomial Random Variables
Suppose we conduct an experiment observing an n-trial (fixed) Bernoulli process. If we are interested in the RV X={Number of successes in the n trials}, then X is called a Binomial RV and its distribution is called Binomial Distribution.
Examples
- Roll a standard die ten times. Let X be the number of times {6} turned up. The distribution of the random variable X is a binomial distribution with n = 10 (number of trials) and p = 1/6 (probability of "success={6}). The distribution of X may be explicitely written as (P(X=x) are rounded of, you can compute these exactly by going to [http://socr.ucla.edu/htmls/SOCR_Distributions.html SOCR Distributions and selecting Binomial):
| x | 0 | 1 | 2 | 3 | 4 | 5 | 6 | 7 | 8 | 9 | 10 |
| P(X=x) | 0.162 | 0.323 | 0.291 | 0.155 | 0.0543 | 0.013 | 0.0022 | 0.00025 | 0.000019 | 8.269e-7 | 1.654e-8 |

- Suppose 10% of the human population carries the green-eye alial. If we choose 1,000 people randomly and let the RV X be the number of green-eyed people in the sample. Then the distribution of X is binomial distribution with n = 1,000 and p = 0.1 (denoted as
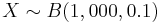 .
.
Binomial Modeling
Exact Binomila Model
The Binomial distribution (i.e., biased-coin tossing experiment) is an exact physical model for any experiment which can be characterized as a series of trials where:
- Each trial has only two outcomes: success or failure;
- P(success)=p is the same for every trial; and
- Trials are independent.
Approximate Binomial Model
If we observe an experiment comprized of n identical trials involving a large population (of size N). Suppose the population contains a sub-population of subjects that have a characteristic of interest and the sub-population proportion is p (0<p<1). Then the distribution of X={the number of outcomes in the sample with that characteristic of interest}, is approximately Binomial(n, p). This approximation is adequate if the ratio n/N < 0.05.
- Example: Polling the US population to see what proportion is/has-been married. Because we sample without replacement (can't ask the same individual twice), the second assumption of the (exact) Binomial model is (slightly) violated. Yet, the small ration of sample to population size yields that the Binomial model is approximately valid (i.e., the proportion of subjects that is/has-been married does not change significantly as we poll one subject, and therefore remove him/her from the complete pool of subjects we poll).
Binomial Probabilities
If the random variable X follows the Binomial distribution with (fixed) parameters n (sample-size) and p (probability of success at one trial), we write X ~ B(n, p). The probability of getting exactly x successes is given by the Binomila probability (or mass) function: 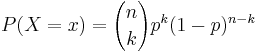 , for x = 0, 1, 2, ..., n, where
 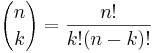 is the binomial coefficient.
This probability expression has an easy and intuitive interpretation. The probability of the x successes in the n trials is (px). Similarly, the probability of the n-x failures is (1 − p)n-x. However, the x successes can be arranged anywhere among the n trials, and there are different ways of arranging the x successes in a sequence of n trials, see the Counting section.
Model Validation
Checking/affirming underlying assumptions.
- TBD
Computational Resources: Internet-based SOCR Tools
- TBD
Examples
Computer simulations and real observed data.
- TBD
Hands-on activities
Step-by-step practice problems.
- TBD
References
- TBD
- SOCR Home page: http://www.socr.ucla.edu
Translate this page:
