AP Statistics Curriculum 2007 Estim Proportion
From Socr
(Difference between revisions)
| Line 2: | Line 2: | ||
=== Estimating a Population Proportion=== | === Estimating a Population Proportion=== | ||
| - | |||
| - | |||
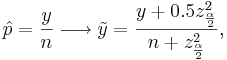
| - | == | + | When the sample size is large, the sampling distribution of the sample proportion <math>\hat{p}</math> is approximately Normal, by [[AP_Statistics_Curriculum_2007_Limits_CLT |CLT]], as the sample proportion may be presented as a [[AP_Statistics_Curriculum_2007_Limits_Norm2Bin |sample average or Bernoulli random variables]]. When the sample size is small, the normal approximation may be inadequate. To accommodate this we will modify <math>\hat{p}</math> slightly |
| - | + | : <math>\hat{p}={y\over n} \longrightarrow \tilde{y}={y+0.5z_{\alpha \over 2}^2 \over n+z_{\alpha \over 2}^2},</math> | |
| + | where [[AP_Statistics_Curriculum_2007_Normal_Critical | <math>z_{\alpha \over 2}</math> is the normal critical value we saw earlier]]. | ||
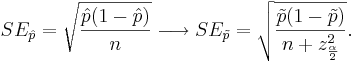
| - | + | The standard error of <math>\hat{p}</math> also needs a slight modification | |
| + | : <math>SE_{\hat{p}} = \sqrt{\hat{p}(1-\hat{p})\over n} \longrightarrow SE_{\tilde{p}} = \sqrt{\tilde{p}(1-\tilde{p})\over n+z_{\alpha \over 2}^2}.</math> | ||
| + | |||
| + | |||
| + | ===Confidence intervals for proportions=== | ||
| + | |||
| + | The confidence intervals for the sample proportion <math>\hat{p}</math> and the corrected-sample-proportion <math>\tilde{p}</math> are given by | ||
| + | : <math>\hat{p}\pm z_{\alpha\over 2} SE_{\hat{p}}</math> | ||
| + | |||
| + | :<math>\tilde{p}\pm z_{\alpha\over 2} SE_{\tilde{p}}</math> | ||
===Model Validation=== | ===Model Validation=== | ||
Revision as of 05:11, 4 February 2008
Contents |
General Advance-Placement (AP) Statistics Curriculum - Estimating a Population Proportion
Estimating a Population Proportion
When the sample size is large, the sampling distribution of the sample proportion  is approximately Normal, by CLT, as the sample proportion may be presented as a sample average or Bernoulli random variables. When the sample size is small, the normal approximation may be inadequate. To accommodate this we will modify slightly
where  is the normal critical value we saw earlier.
The standard error of also needs a slight modification
Confidence intervals for proportions
The confidence intervals for the sample proportion and the corrected-sample-proportion  are given by


Model Validation
Checking/affirming underlying assumptions.
- TBD
Computational Resources: Internet-based SOCR Tools
- TBD
Examples
Computer simulations and real observed data.
- TBD
Hands-on activities
Step-by-step practice problems.
- TBD
References
- TBD
- SOCR Home page: http://www.socr.ucla.edu
Translate this page:
