AP Statistics Curriculum 2007 Infer 2Means Dep
From Socr
Contents
|
General Advance-Placement (AP) Statistics Curriculum - Inferences about Two Means: Dependent Samples
In the previous chapter we saw how to do significance testing in the case of a single random sample. Now, we show how to do hypothesis testing comparing two samples and we begin with the simple case of paired samples.
Inferences about Two Means: Dependent Samples
In all study designs it is always critical to clearly identify whether samples we compare come from dependent or independent populations. There is a general formulation for the significance testing when the samples are independent. The fact that there may be uncountably many differnt types of dependencies prevents us from having a similar analysis protocol for all dependent sample cases. However, in one sepecific case - paired samples - we have the theory to generalize the significance testing analysis proitocol. Two populations (or samples) are dependent because of pairing (or paired) if they are linked in some way, usually by a direct relationship. For example, measure the weight of subjects before and after a six month diet.
Paired Designs
These are the most common Paired Designs where the idea of pairing is that members of a pair are similar to each other with respect to extraneous variables.
- Randomized block experiments with two units per block
- Observational studies with individually matched controls (e.g., clinical trials of drug efficacy - patient pre vs. post treatment results are compared)
- Repeated (time or treatment affected) measurements on the same individual
- Blocking by time – formed implicitly when replicate measurements are made at different times.
Background
- Recall that for a random sample {
 } of the process, the population mean may be estimated by the sample average,
  .
.
- The standard error of
 is given by
  .
.
Paired Analysis Protocol
To study paired data we would like to examine the differences between each pair. Suppose { } and {
 } represent to paired samples. The we want to study the difference sample {
 }. Notice the effect of the pairings of each
  and
and  .
.
Now we can clearly see that the group effect (group differences) are directly represented in the {di} sequence. The one-sample T test is the proper strategy to analyze the difference sample {di}, if the and samples come from Normal distributions.
Because we are focusing on the differences, we can use the same reasoning as we did in the single sample case to calculate the standard error (i.e., the standard deviation of the sampling distribution of  ) of
) of  .
.
Thus, the standard error of is given by  , where
  .
.
Two-Sample Hypothesis Testing about a Mean
- Null Hypothesis: Ho:μ1 − μ2 = μo (e.g..., μ1 − μ2 = 0)
- Alternative Research Hypotheses:
- One sided (uni-directional): H1:μ1 − μ2 > μo, or Ho:μ1 − μ2 < μo
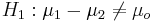
- Double sided:
Test Statistics
- If the two populations that the {} and {} samples were drawn from are approximately Normal, then the Test statistics is:
-
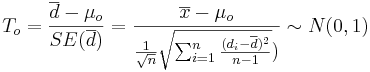 .
.
Example
Suppose we measure the thickness of plaque (mm) in the carotid artery of 10 randomly selected patients with mild atherosclerotic disease. Two measurements are taken, thickness before treatment with Vitamin E (baseline) and after two years of taking Vitamin E daily.
- What makes this paired data rather than independent data?
- Why would we want to use pairing in this example?
Data in row format
| Before | 0.66,0.72,0.85,0.62,0.59,0.63,0.64,0.7,0.73,0.68 |
| After | 0.6,0.65,0.79,0.63,0.54,0.55,0.62,0.67,0.68,0.64 |
Data in column format
| Subject | Before | After | Difference |
|---|---|---|---|
| 1 | 0.66 | 0.60 | 0.06 |
| 2 | 0.72 | 0.65 | 0.07 |
| 3 | 0.85 | 0.79 | 0.06 |
| 4 | 0.62 | 0.63 | -0.01 |
| 5 | 0.59 | 0.54 | 0.05 |
| 6 | 0.63 | 0.55 | 0.08 |
| 7 | 0.64 | 0.62 | 0.02 |
| 8 | 0.70 | 0.67 | 0.03 |
| 9 | 0.73 | 0.68 | 0.05 |
| 10 | 0.68 | 0.64 | 0.04 |
| Mean | 0.682 | 0.637 | 0.045 |
| SD | 0.0742 | 0.0709 | 0.0264 |
Exploratory Data Analysis
We begin first by exploring the data visually using various SOCR EDA Tools.
- Index plot of the differences

- Index plot of the differences

- Index plot of the differences

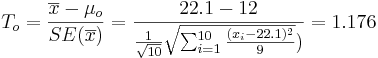
As the population variance is not given, we have to use the T-statistics: 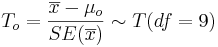
-
 .
.
- p − value = P(T(df = 9) > To = 1.176) = 0.134882 for this (one-sided) test. Therefore, we can not reject the null hypothesis at α = 0.01! The left white area at the tails of the T(df=9) distribution depict graphically the probability of interest, which represents the strenght of the evidence (in the data) against the Null hypothesis. In this case, this area is 0.134882, which is larger than the initially set Type I error α = 0.01 and we can not reject the null hypothesis.

- You can see use the SOCR Analyses (One-Sample T-Test) to carry out these calculations as shown in the figure below.

- This SOCR One Smaple T-test Activity provides additional hands-on demonstrations of one-sample hypothesis testing.
Examples
Cavendish Mean Density of the Earth
A number of famous early experiments of measuring physical constants have later been shown to be biased. In the 1700's Henry Cavendish measured the Mean density of the Earth. Formulate and test null and research hypotheses about these data regarding the now know exact mean-density value = 5.517. These sample statistics may be helpful
- n = 23, sample mean = 5.483, sample SD = 0.1904
| 5.36 | 5.29 | 5.58 | 5.65 | 5.57 | 5.53 | 5.62 | 5.29 | 5.44 | 5.34 | 5.79 | 5.10 | 5.27 | 5.39 | 5.42 | 5.47 | 5.63 | 5.34 | 5.46 | 5.30 | 5.75 | 5.68 | 5.85 |
References
- SOCR Home page: http://www.socr.ucla.edu
Translate this page:
