AP Statistics Curriculum 2007 Infer 2Means Indep
From Socr
| Line 1: | Line 1: | ||
| - | ==[[AP_Statistics_Curriculum_2007 | General Advance-Placement (AP) Statistics Curriculum]] - Inferences about Two Means: Independent | + | ==[[AP_Statistics_Curriculum_2007 | General Advance-Placement (AP) Statistics Curriculum]] - Inferences about Two Means: Independent Samples== |
| - | + | In the [[AP_Statistics_Curriculum_2007_Infer_2Means_Dep | previous section we discussed the inference on two paired random samples]]. Now, we show how to do inference on two independent samples. | |
| - | + | ||
| - | + | ||
| - | === | + | ===Indepenent Samples Designs=== |
| - | + | Independent samples designs refer to design of experiments or observations where all measurements are individually independent from each other within their groups and the groups are independent. The groups may be drawn from different populations with different distribution characteristics. | |
| - | * | + | ===[[AP_Statistics_Curriculum_2007_Estim_L_Mean | Background]]=== |
| + | * Recall that for a random sample {<math>X_1, X_2, X_3, \cdots , X_n</math>} of the process, the population mean may be estimated by the sample average, <math>\overline{X_n}={1\over n}\sum_{i=1}^n{X_i}</math>. | ||
| - | = | + | * The standard error of <math>\overline{x}</math> is given by <math>{{1\over \sqrt{n}} \sqrt{\sum_{i=1}^n{(x_i-\overline{x})^2\over n-1}}}</math>. |
| - | + | ||
| - | + | ===Analysis Protocol for Independent Designs=== | |
| + | To study independent samples we would like to examine the differences between two group means. Suppose {<math>X_1^1, X_2^1, X_3^1, \cdots , X_n^1</math>} and {<math>Y_1^2, Y_2^2, Y_3^2, \cdots , Y_n^2</math>} represent the two independent samples. Then we want to study the differences of the two group means relative to the internal sample variations. If the two samples were drawn from populations that had different [[AP_Statistics_Curriculum_2007_EDA_Center |centers]], then we would expect that the two sample averages will be distinct. | ||
| - | === | + | ====Large Samples==== |
| - | + | *Significance Testing: We have a standard null-hypothesis <math>H_o: \mu_X -\mu_Y = \mu_o</math> (e.g., <math>\mu_o=0</math>). Then the test statistics is: | |
| + | : <math>Z_o = {\overline{x}-\overline{y}-\mu_o \over SE(\overline{x}-\overline{y})} \sim N(0,1)</math>. | ||
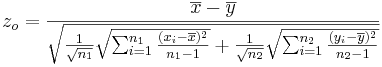
| + | : <math>z_o= {\overline{x}-\overline{y} \over \sqrt{{1\over \sqrt{n_1}} \sqrt{\sum_{i=1}^{n_1}{(x_i-\overline{x})^2\over n_1-1}} + {1\over \sqrt{n_2}} \sqrt{\sum_{i=1}^{n_2}{(y_i-\overline{y})^2\over n_2-1}}}}</math> | ||
| - | === | + | * Confidence Intervals: <math>(1-\alpha)100%</math> confidence interval for <math>\mu_1-\mu_2</math> will be |
| - | + | : <math>CI(\alpha): \overline{x}-\overline{y} \pm z_{\alpha\over 2} SE(\overline{x}-\overline{y})= \overline{x}-\overline{y} \pm z_{\alpha\over 2} \sqrt{{1\over \sqrt{n_1}} \sqrt{\sum_{i=1}^{n_1}{(x_i-\overline{x})^2\over n_1-1}} + {1\over \sqrt{n_2}} \sqrt{\sum_{i=1}^{n_2}{(y_i-\overline{y})^2\over n_2-1}}}</math>. Note that the <math>SE(\overline{x} -\overline{x})=\sqrt{SE(\overline{x})+SE(\overline{y})}</math>, as the samples are independent. Also, <math>z_{\alpha\over 2}</math> is the [[AP_Statistics_Curriculum_2007_Normal_Critical | critical value]] for a [[AP_Statistics_Curriculum_2007_Normal_Std |Standard Normal]] distribution at <math>{\alpha\over 2}</math>. | |
| + | |||
| + | ====Small Samples==== | ||
| - | |||
| - | |||
| - | |||
| - | |||
| - | |||
<hr> | <hr> | ||
===References=== | ===References=== | ||
| - | |||
<hr> | <hr> | ||
Revision as of 04:55, 10 February 2008
Contents |
General Advance-Placement (AP) Statistics Curriculum - Inferences about Two Means: Independent Samples
In the previous section we discussed the inference on two paired random samples. Now, we show how to do inference on two independent samples.
Indepenent Samples Designs
Independent samples designs refer to design of experiments or observations where all measurements are individually independent from each other within their groups and the groups are independent. The groups may be drawn from different populations with different distribution characteristics.
Background
- Recall that for a random sample {
 } of the process, the population mean may be estimated by the sample average,
  .
.
- The standard error of
 is given by
  .
.
Analysis Protocol for Independent Designs
To study independent samples we would like to examine the differences between two group means. Suppose { } and {
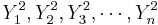 } represent the two independent samples. Then we want to study the differences of the two group means relative to the internal sample variations. If the two samples were drawn from populations that had different centers, then we would expect that the two sample averages will be distinct.
Large Samples
- Significance Testing: We have a standard null-hypothesis Ho:μX − μY = μo (e.g., μo = 0). Then the test statistics is:
-
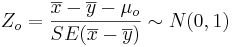 .
.
-
- Confidence Intervals: (1 − α)100% confidence interval for μ1 − μ2 will be
-
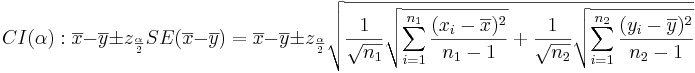 . Note that the
  , as the samples are independent. Also,
  is the critical value for a Standard Normal distribution at
  .
.
Small Samples
References
- SOCR Home page: http://www.socr.ucla.edu
Translate this page:
