AP Statistics Curriculum 2007 IntroVar
From Socr
(→The Nature of Data & Variation) |
m (→The Nature of Data & Variation: typo) |
||
| (10 intermediate revisions not shown) | |||
| Line 2: | Line 2: | ||
==The Nature of Data & Variation== | ==The Nature of Data & Variation== | ||
| - | No matter how controlled the environment, the protocol or the design, virtually any repeated measurement, observation, experiment, trial, study or survey is | + | No matter how controlled are the environment, the protocol or the design, virtually any repeated measurement, observation, experiment, trial, study or survey is bounded to generate data that varies because of intrinsic (internal to the system) or extrinsic (due to the ambient environment) effects. |
| - | For example, the UCLA's [[AP_Statistics_Curriculum_2007_IntroVar#References | study of Alzheimer’s disease*]] analyzed the data of 31 MCI and 34 probable Alzheimer’s disease patients. The investigators made every attempt to control as many variables as possible | + | For example, the UCLA's [[AP_Statistics_Curriculum_2007_IntroVar#References | study of Alzheimer’s disease*]] analyzed the data of 31 Mild Cognitive Impairment (MCI) and 34 probable Alzheimer’s disease (AD) patients. The investigators made every attempt to control as many variables as possible. Yet, the demographic information they collected from the outcomes of the subjects contained unavoidable variation. The same study found variation in the MMSE cognitive scores even in the same subject. The table below shows the demographic characteristics for the subjects and patients included in this study, where the following notation is used M: male; F: female; W: white; AA: African American; A: Asian: |
| - | <center> | + | <center> |
| + | {| class="wikitable" style="text-align:center; width:75%" border="1" | ||
| + | |- | ||
| + | | '''Variable''' || '''Alzheimer’s disease''' || '''MCI''' || '''Test statistics''' || '''Test score''' || '''P-value''' | ||
| + | |- | ||
| + | | '''Age (years)''' || 76.2 (8.3) range 52–89 || 73.7 (7.4) range 57–84 || Student’s T || <math>t_o = 1.284</math> || ''p=0.21'' | ||
| + | |- | ||
| + | | '''Gender (M:F)''' || 15:19 || 15:16 || Proportion || <math>z_o = -0.345</math> || ''p=0.733'' | ||
| + | |- | ||
| + | | '''Education (years)''' || 14.0 (2.1) range 12–19 || 16.23 (2.7) range 12–20 || Wilcoxon rank sum || <math>w_o = 773.0</math> || ''p<0.001'' | ||
| + | |- | ||
| + | | '''Race (W:AA:A)''' || 29:1:4 || 26:2:3 || <math>\chi_{(df=2)}^2</math> || <math>\chi_{(df=2)}^2=1.18</math> || 0.55 | ||
| + | |- | ||
| + | | '''MMSE''' || 20.9 (6.3) range 4–29 || 28.2 (1.6) range 23–30 || Wilcoxon rank-sum || <math>w_o= 977.5</math> || ''p<0.001'' | ||
| + | |} | ||
| + | </center> | ||
==Approach== | ==Approach== | ||
| - | Models | + | Models and strategies for solving problems and understanding data and inferences. |
* Once we accept that all natural phenomena are inherently variant and there are no completely deterministic processes, we need to look for models and techniques that allow us to study such acquired data in the presence of variation, uncertainty and chance. | * Once we accept that all natural phenomena are inherently variant and there are no completely deterministic processes, we need to look for models and techniques that allow us to study such acquired data in the presence of variation, uncertainty and chance. | ||
| - | * '''Statistics''' is the data science that investigates natural processes and allows us to quantify variation to make population | + | * '''Statistics''' is the data science that investigates natural processes and allows us to quantify variation to make population inferences based on limited observations. |
==Model Validation== | ==Model Validation== | ||
| Line 21: | Line 36: | ||
* Such prior model conjectures or presumptions could take the form of mathematical constraints about the properties of the underlying process, restrictions on the study design or demands on the data acquisition protocol. | * Such prior model conjectures or presumptions could take the form of mathematical constraints about the properties of the underlying process, restrictions on the study design or demands on the data acquisition protocol. | ||
| - | * Common assumptions include (statistical) independence of the measurements, specific limitations on the shape of the observed distribution, restrictions on the parameters of the processes being studied , etc. | + | * Common assumptions include (statistical) independence of the measurements, specific limitations on the shape of the observed distribution, restrictions on the parameters of the processes being studied, etc. |
==Computational Resources: Internet-based SOCR Tools== | ==Computational Resources: Internet-based SOCR Tools== | ||
| - | * The [[SOCR]] resource contains a variety of educational materials, demonstration applets and learning | + | * The [[SOCR]] resource contains a variety of educational materials, demonstration applets and learning resources that illustrate data generation, experimentation, exploratory and statistical data analysis. |
* [[SOCR_EduMaterials_Activities_RNG | (Numeric Pseudo-Random) Data Generation]] | * [[SOCR_EduMaterials_Activities_RNG | (Numeric Pseudo-Random) Data Generation]] | ||
* [[SOCR_EduMaterials_ExperimentsActivities | Interactive SOCR Experimentation]] with computer generated models of natural phenomena | * [[SOCR_EduMaterials_ExperimentsActivities | Interactive SOCR Experimentation]] with computer generated models of natural phenomena | ||
| Line 30: | Line 45: | ||
* [[SOCR_EduMaterials_Activities_Histogram_Graphs | Exploratory Data Analysis]] | * [[SOCR_EduMaterials_Activities_Histogram_Graphs | Exploratory Data Analysis]] | ||
* [[SOCR_EduMaterials_AnalysisActivities_ANOVA_1 | Statistical Data Analysis]] | * [[SOCR_EduMaterials_AnalysisActivities_ANOVA_1 | Statistical Data Analysis]] | ||
| + | |||
| + | ==Datasets== | ||
| + | There are [[SOCR_Data | a number of large, natural, useful and demonstrative datasets]] that are provided as part of this statistics [[EBook]]. Many of these data collections are intentionally selected to be large and complex. This choice is driven by the need of emphasizing the symbiosis between driving challenges, statistical concepts, mathematical derivations and the use of technology to solve relevant research problems. | ||
==Examples== | ==Examples== | ||
| Line 41: | Line 59: | ||
* [[SOCR_EduMaterials_Activities_Histogram_Graphs | Histograms and Frequency Graphs Activity]] | * [[SOCR_EduMaterials_Activities_Histogram_Graphs | Histograms and Frequency Graphs Activity]] | ||
* [[SOCR_EduMaterials_Activities_CardsCoinsSampling | Bivariate Cards and Coins Meta-Activity]] | * [[SOCR_EduMaterials_Activities_CardsCoinsSampling | Bivariate Cards and Coins Meta-Activity]] | ||
| + | |||
| + | ==[[EBook_Problems_EDA_IntroVar|Problems]]== | ||
<hr> | <hr> | ||
| - | + | ==References== | |
* Apostolova LG, Dinov ID, Dutton RA, Hayashi KM, Toga AW, Cummings JL, Thompson PM. [http://brain.oxfordjournals.org/cgi/reprint/awl274v1.pdf 3D comparison of hippocampal atrophy in amnestic mild cognitive impairment and Alzheimer's disease.] Brain. 2006 Nov; 129(Pt 11):2867-73. | * Apostolova LG, Dinov ID, Dutton RA, Hayashi KM, Toga AW, Cummings JL, Thompson PM. [http://brain.oxfordjournals.org/cgi/reprint/awl274v1.pdf 3D comparison of hippocampal atrophy in amnestic mild cognitive impairment and Alzheimer's disease.] Brain. 2006 Nov; 129(Pt 11):2867-73. | ||
Current revision as of 17:42, 31 March 2013
General Advance-Placement (AP) Statistics Curriculum - Introduction to Statistics
Contents |
The Nature of Data & Variation
No matter how controlled are the environment, the protocol or the design, virtually any repeated measurement, observation, experiment, trial, study or survey is bounded to generate data that varies because of intrinsic (internal to the system) or extrinsic (due to the ambient environment) effects.
For example, the UCLA's study of Alzheimer’s disease* analyzed the data of 31 Mild Cognitive Impairment (MCI) and 34 probable Alzheimer’s disease (AD) patients. The investigators made every attempt to control as many variables as possible. Yet, the demographic information they collected from the outcomes of the subjects contained unavoidable variation. The same study found variation in the MMSE cognitive scores even in the same subject. The table below shows the demographic characteristics for the subjects and patients included in this study, where the following notation is used M: male; F: female; W: white; AA: African American; A: Asian:
| Variable | Alzheimer’s disease | MCI | Test statistics | Test score | P-value |
| Age (years) | 76.2 (8.3) range 52–89 | 73.7 (7.4) range 57–84 | Student’s T | to = 1.284 | p=0.21 |
| Gender (M:F) | 15:19 | 15:16 | Proportion | zo = − 0.345 | p=0.733 |
| Education (years) | 14.0 (2.1) range 12–19 | 16.23 (2.7) range 12–20 | Wilcoxon rank sum | wo = 773.0 | p<0.001 |
| Race (W:AA:A) | 29:1:4 | 26:2:3 |  | 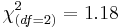 | 0.55 |
| MMSE | 20.9 (6.3) range 4–29 | 28.2 (1.6) range 23–30 | Wilcoxon rank-sum | wo = 977.5 | p<0.001 |
Approach
Models and strategies for solving problems and understanding data and inferences.
- Once we accept that all natural phenomena are inherently variant and there are no completely deterministic processes, we need to look for models and techniques that allow us to study such acquired data in the presence of variation, uncertainty and chance.
- Statistics is the data science that investigates natural processes and allows us to quantify variation to make population inferences based on limited observations.
Model Validation
Checking/affirming underlying assumptions.
- Each model or technique for data exploration, analysis and understanding relies on a set of assumptions, which always need to be validated before the model or analysis tool is employed to study real data (observations or measurements that are perceived or detected by the investigator).
- Such prior model conjectures or presumptions could take the form of mathematical constraints about the properties of the underlying process, restrictions on the study design or demands on the data acquisition protocol.
- Common assumptions include (statistical) independence of the measurements, specific limitations on the shape of the observed distribution, restrictions on the parameters of the processes being studied, etc.
Computational Resources: Internet-based SOCR Tools
- The SOCR resource contains a variety of educational materials, demonstration applets and learning resources that illustrate data generation, experimentation, exploratory and statistical data analysis.
- (Numeric Pseudo-Random) Data Generation
- Interactive SOCR Experimentation with computer generated models of natural phenomena
- Exploratory Data Analysis
- Statistical Data Analysis
Datasets
There are a number of large, natural, useful and demonstrative datasets that are provided as part of this statistics EBook. Many of these data collections are intentionally selected to be large and complex. This choice is driven by the need of emphasizing the symbiosis between driving challenges, statistical concepts, mathematical derivations and the use of technology to solve relevant research problems.
Examples
Computer simulations and real observed data.
- For example, exploratory data analysis using data histograms. This SOCR activity illustrates the generation and interpretation of the histogram of quantitative data.
Hands-on activities
Step-by-step practice problems.
Problems
References
- Apostolova LG, Dinov ID, Dutton RA, Hayashi KM, Toga AW, Cummings JL, Thompson PM. 3D comparison of hippocampal atrophy in amnestic mild cognitive impairment and Alzheimer's disease. Brain. 2006 Nov; 129(Pt 11):2867-73.
- SOCR Home page: http://www.socr.ucla.edu
Translate this page:
