AP Statistics Curriculum 2007 Limits Poisson2Bin
From Socr
(Difference between revisions)
m |
|||
| Line 2: | Line 2: | ||
=== Poisson as Approximation to Binomial Distribution=== | === Poisson as Approximation to Binomial Distribution=== | ||
| - | + | The [[AP_Statistics_Curriculum_2007_Distrib_Poisson#Poisson_as_a_limiting_case_of_Binomial_distribution | complete details of the Poisson distribution as a limiting case of the Binomial Distirbution are contained here.]] | |
| - | + | ||
| - | + | * Note that the conditions of [[AP_Statistics_Curriculum_2007_Distrib_Poisson | Poisson]] approximation to [[AP_Statistics_Curriculum_2007_Distrib_Binomial | Binomial]] are complementary to the [[AP_Statistics_Curriculum_2007_Limits_Norm2Bin | conditions for Normal approximation of Binomial distribution]]. Poisson approximation to Binomial is an appropriate when: | |
| - | + | : <math>np < 10</math> | |
| - | + | : <math>n \geq 20</math> and <math>p \leq 0.05</math>. | |
| - | + | ||
| - | + | ||
| - | + | ||
| - | + | ||
| - | + | ||
| - | + | ||
| - | + | ||
| - | + | ||
| - | + | ||
===Examples=== | ===Examples=== | ||
| - | + | The [[About_pages_for_SOCR_Distributions | Binomial distribution]] can be approximated well by Poisson when <math> n </math> is large and <math> p </math> is small with <math> np < 7 </math>. This is true because | |
| - | + | <math> \lim_{n \rightarrow \infty} | |
| - | + | {n \choose x} p^x(1-p)^{n-x}=\frac{\lambda^x e^{-\lambda}}{x!} </math>, where | |
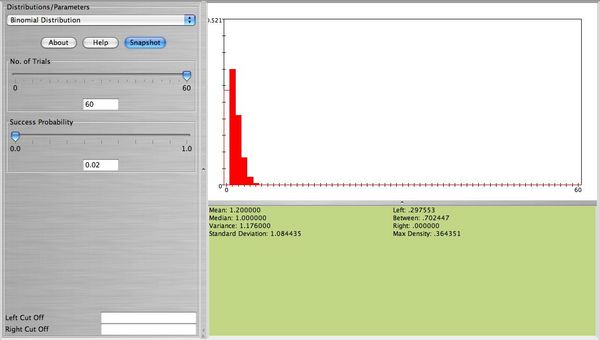
| - | + | <math> \lambda=np </math>. Here is an example. Suppose <math> 2\% </math> of a certain population have Type AB blood. Suppose 60 people from this population are randomly selected. The number of people <math> X </math> among the 60 that have Type AB blood follows the Binomial distribution with <math> n=60, p=0.02 </math>. The figure below represents the distribution of <math> X </math>. This figure also shows <math> P(X=0) </math>. | |
| - | = | + | <center>[[Image: SOCR_Activities_ExploreDistributions_Christou_figure13.jpg|600px]]</center> |
| - | + | ||
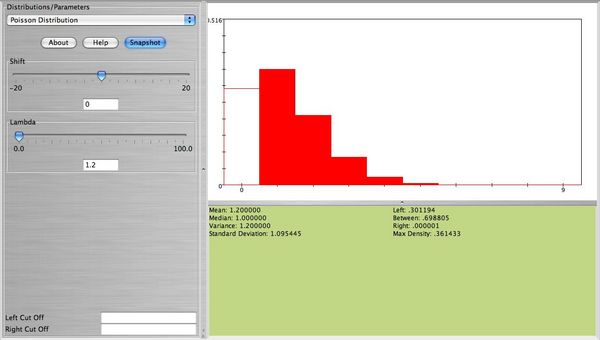
| - | * | + | * '''Note''': This distribution can be approximated well with Poisson with <math> \lambda=np=60(0.02)=1.2 </math>. The figure below is approximately the same as the figure above (the width of the bars is not important here. The height of each bar represents the probability for each value of <math> X </math> which is about the same for both distributions). |
| + | <center>[[Image: SOCR_Activities_ExploreDistributions_Christou_figure14.jpg|600px]]</center> | ||
<hr> | <hr> | ||
===References=== | ===References=== | ||
| - | |||
<hr> | <hr> | ||
Revision as of 01:33, 3 February 2008
Contents |
General Advance-Placement (AP) Statistics Curriculum - Poisson as Approximation to Binomial Distribution
Poisson as Approximation to Binomial Distribution
- Note that the conditions of Poisson approximation to Binomial are complementary to the conditions for Normal approximation of Binomial distribution. Poisson approximation to Binomial is an appropriate when:
- np < 10
-
 and
and  .
.
Examples
The Binomial distribution can be approximated well by Poisson when n is large and p is small with np < 7. This is true because
 , where
λ = np. Here is an example. Suppose
  of a certain population have Type AB blood. Suppose 60 people from this population are randomly selected. The number of people X among the 60 that have Type AB blood follows the Binomial distribution with n = 60,p = 0.02. The figure below represents the distribution of X. This figure also shows P(X = 0).

- Note: This distribution can be approximated well with Poisson with λ = np = 60(0.02) = 1.2. The figure below is approximately the same as the figure above (the width of the bars is not important here. The height of each bar represents the probability for each value of X which is about the same for both distributions).

References
- SOCR Home page: http://www.socr.ucla.edu
Translate this page:
