Introduction to Normal Distribution
From Socr
- Go to www.socr.ucla.edu
- Click the "Distributions" tab
- In the drop-down menu on the left, select Normal Distribution
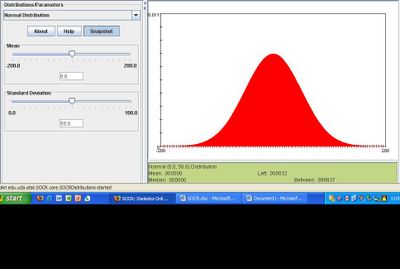
You should see something like this:
- This is the standard normal distribution. In this distribution, the mean, median, and mode all appear at the center. Half of the data falls into the left side of the center and half falls into the right side.
- In the picture above, the distribution has a mean of 0, and a standard deviation of 50.
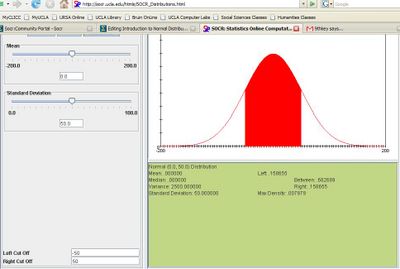
- If you scroll down, you will see a box labeled "Left Cut Off" and another labeled "Right Cut Off." You can use these to find what percent of the values fall between certain values.
- Try typing -50 in the left cutoff box and 50 in the right cutoff box. This represents the area between -1 standard deviation and +1 standard deviation. You should see something like this:
My Activities
- SOCR Home page: http://www.socr.ucla.edu
Translate this page:


