SOCR Data Dinov 071108 OilGasData
From Socr
Contents
|
SOCR Data - Oil, Gas, Nuclear and Alternative Energy Resources, Production and Consumption
Data Description

The data below present a graphical overview of energy history in the United States between 1949-2007. These data reveal sweeping trends related to the US’s acquisition and use of energy resources. Energy can be grouped into three broad categories.
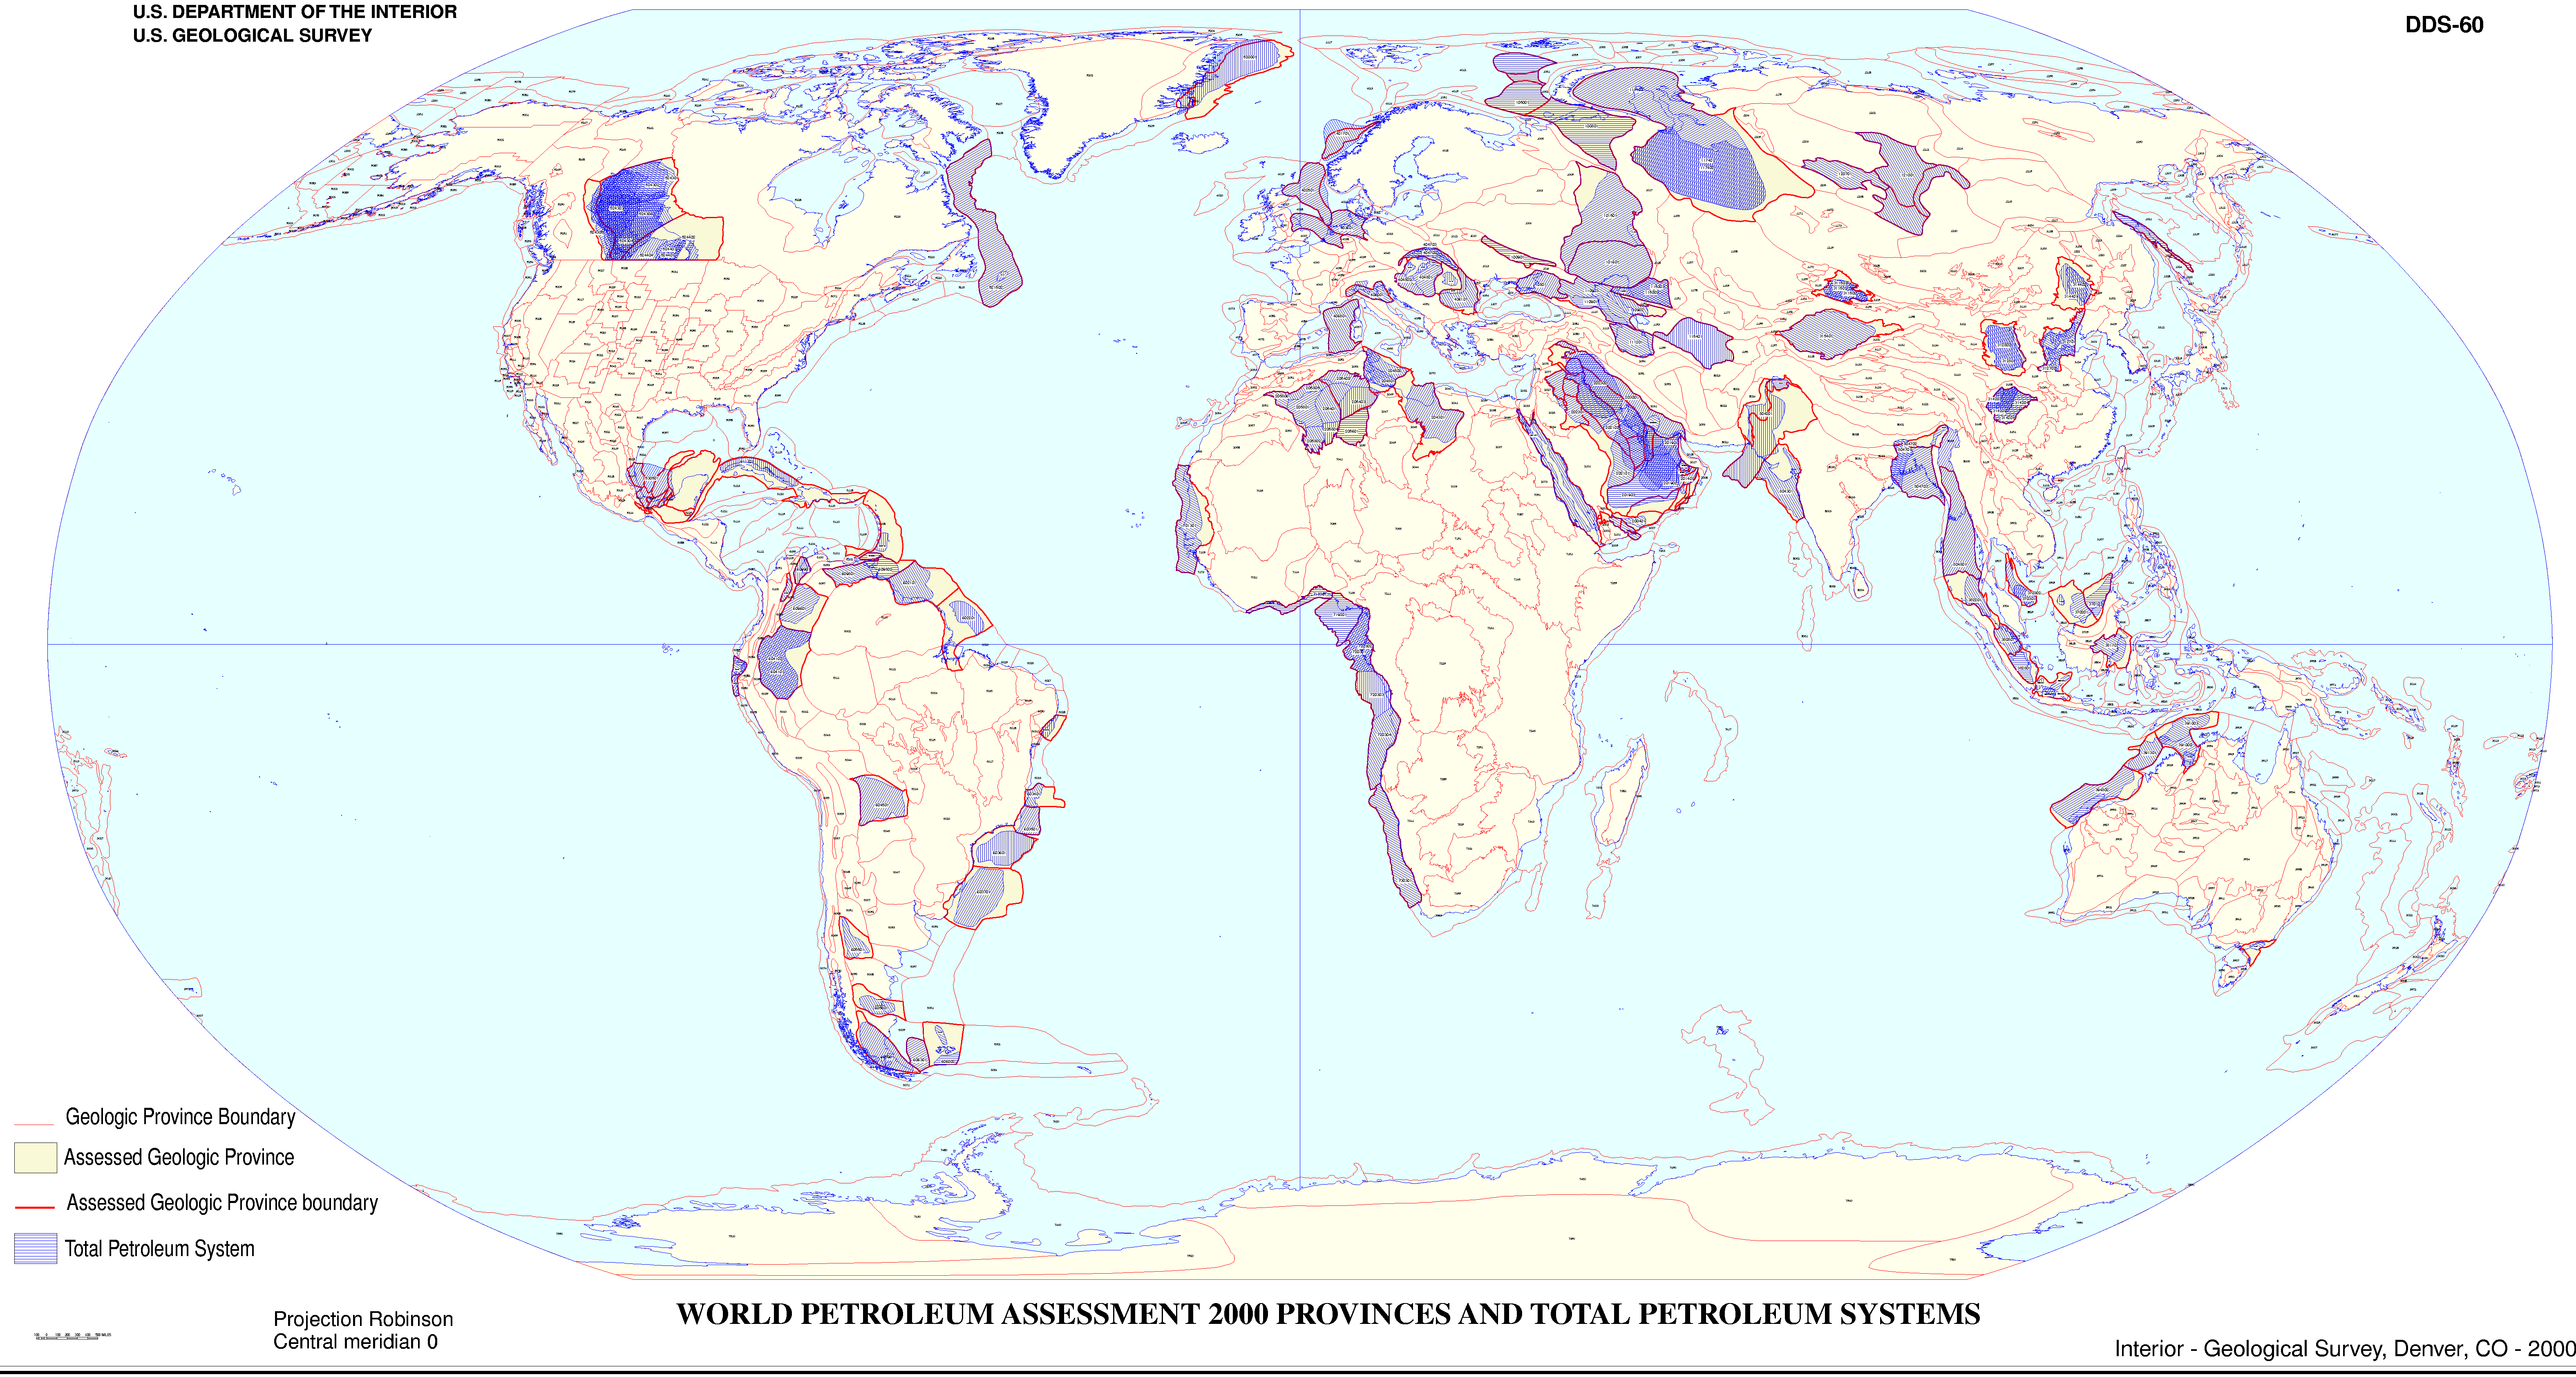
- Complete (large-resolution map) of the World Petroleum Reserves
- First are the fossil fuels - coal, petroleum, and natural gas. Fossil fuels are nature’s batteries; they have stored the sun’s energy over millennia past, and it is primarily that captured energy that we are drawing on today to fuel the activities of the modern economy. Use of the individual fossil fuels changed at different rates over the decades but all three major forms have been essential to meeting the Nation’s energy requirements. In 1949, fossil fuel consumption in the United States totaled 29 quadrillion British thermal units (Btu); in 2007, the total was 86 quadrillion Btu.
- Second major form of energy is nuclear power, which is a relative newcomer in the energy business. The nuclear electric power industry got its start in this country in 1957 when the Shippingport, Pennsylvania, nuclear electric power plant came on line. By 2007, the industry had expanded to supply 19 percent of the Nation’s electrical output and 8 percent of all energy used in the country.
- Third, are the renewable forms of energy. Unlike fossil fuels, which are finite in supply, renewable energy is essentially inexhaustible because it is naturally replenished. Renewable energy includes conventional hydroelectric power, which is power derived from falling water; biomass such as wood, waste, and biofuels; geothermal; solar; and wind. Before the great expansion in fossil fuel use that began with coal in the late 1800s, wood was the primary fuel used in this country. Today, we are looking again at renewable resources to find new ways to use them to help meet our energy needs. In 2007, all forms of renewable energy together accounted for 7 percent of U.S. total energy consumption.
- Source: US Energy Information Administration.
Data Interpretation

- R=Revised. P=Preliminary. (s)=Less than 0.0005 quadrillion Btu.
- 1 (See Note 1), "Primary Energy Production," at end of section.
- 2 (See Note 2), "Primary Energy Consumption," at end of section.
- 3 Net imports equal imports minus exports. Minus sign indicates exports are greater than imports. * 4 Coal, natural gas (dry), crude oil, and natural gas plant liquids.
- 5 See Tables 10.1-10.2c for notes on series components and estimation.
- 6 Crude oil and petroleum products. Includes imports into the Strategic Petroleum Reserve. Note: Totals may not equal sum of components due to independent rounding.
- 7 Also includes natural gas, coal, coal coke, fuel ethanol, and electricity. Sources: Tables 1.2, 1.3, and 1.4.
- 8 Also includes natural gas, petroleum, coal coke, and electricity.
- 9 Calculated as consumption and exports minus production and imports. Includes petroleum stock change and adjustments; natural gas net storage withdrawals and balancing item; coal stock change, losses, and unaccounted for; and fuel ethanol stock change.
- 10 Coal, coal coke net imports, natural gas, and petroleum.
- 11 Also includes electricity net imports.
Primary Energy Data, 1949-2007
| Primary Energy Data, 1949-2007 (Quadrillion Btu) | ||||||||||||||
|---|---|---|---|---|---|---|---|---|---|---|---|---|---|---|
| Year | Production (1) | Trade | Stock Change and Other (9) | Consumption (2) | ||||||||||
| Fossil Fuels (4) | Nuclear Electric Power | Renewable Energy (5) | Total | Imports | Exports | Net Imports (3) | Fossil Fuels (10) | Nuclear Electric Power | Renewable Energy (5) | Total (11) | ||||
| Petroleum (6) | Total (7) | Coal | Total (8) | Total | ||||||||||
| 1949 | 28.748 | 0.000 | 2.974 | 31.722 | 1.427 | 1.448 | 0.877 | 1.592 | -0.144 | 0.403 | 29.002 | 0.000 | 2.974 | 31.982 |
| 1950 | 32.563 | .000 | 2.978 | 35.540 | 1.886 | 1.913 | .786 | 1.465 | .448 | -1.372 | 31.632 | .000 | 2.978 | 34.616 |
| 1951 | 35.792 | .000 | 2.958 | 38.751 | 1.872 | 1.892 | 1.683 | 2.622 | -.729 | -1.047 | 34.008 | .000 | 2.958 | 36.974 |
| 1952 | 34.977 | .000 | 2.940 | 37.917 | 2.114 | 2.146 | 1.403 | 2.365 | -.219 | -.950 | 33.800 | .000 | 2.940 | 36.748 |
| 1953 | 35.349 | .000 | 2.831 | 38.181 | 2.285 | 2.313 | .981 | 1.866 | .447 | -.963 | 34.826 | .000 | 2.831 | 37.664 |
| 1954 | 33.764 | .000 | 2.754 | 36.518 | 2.324 | 2.348 | .911 | 1.696 | .652 | -.531 | 33.877 | .000 | 2.754 | 36.639 |
| 1955 | 37.364 | .000 | 2.784 | 40.148 | 2.752 | 2.790 | 1.465 | 2.286 | .504 | -.444 | 37.410 | .000 | 2.784 | 40.208 |
| 1956 | 39.771 | .000 | 2.851 | 42.622 | 3.166 | 3.207 | 1.984 | 2.945 | .261 | -1.129 | 38.888 | .000 | 2.851 | 41.754 |
| 1957 | 40.133 | 0 | 2.849 | 42.983 | 3.461 | 3.529 | 2.174 | 3.439 | .090 | -1.285 | 38.926 | 0 | 2.849 | 41.787 |
| 1958 | 37.216 | .002 | 2.915 | 40.133 | 3.719 | 3.884 | 1.416 | 2.050 | 1.835 | -.323 | 38.717 | .002 | 2.915 | 41.645 |
| 1959 | 39.045 | .002 | 2.901 | 41.949 | 3.910 | 4.076 | 1.051 | 1.534 | 2.542 | -1.025 | 40.550 | .002 | 2.901 | 43.466 |
| 1960 | 39.869 | .006 | 2.929 | 42.804 | 3.999 | 4.188 | 1.023 | 1.477 | 2.710 | -.427 | 42.137 | .006 | 2.929 | 45.087 |
| 1961 | 40.307 | .020 | 2.953 | 43.280 | 4.192 | 4.437 | .981 | 1.377 | 3.060 | -.602 | 42.758 | .020 | 2.953 | 45.739 |
| 1962 | 41.732 | .026 | 3.119 | 44.877 | 4.562 | 4.994 | 1.083 | 1.473 | 3.522 | -.571 | 44.681 | .026 | 3.119 | 47.828 |
| 1963 | 44.037 | .038 | 3.098 | 47.174 | 4.650 | 5.087 | 1.356 | 1.835 | 3.251 | -.779 | 46.509 | .038 | 3.098 | 49.646 |
| 1964 | 45.789 | .040 | 3.228 | 49.056 | 4.959 | 5.447 | 1.335 | 1.815 | 3.633 | -.872 | 48.543 | .040 | 3.228 | 51.817 |
| 1965 | 47.235 | .043 | 3.398 | 50.676 | 5.402 | 5.892 | 1.376 | 1.829 | 4.063 | -.722 | 50.577 | .043 | 3.398 | 54.017 |
| 1966 | 50.035 | .064 | 3.435 | 53.534 | 5.629 | 6.146 | 1.351 | 1.829 | 4.317 | -.834 | 53.514 | .064 | 3.435 | 57.017 |
| 1967 | 52.597 | .088 | 3.694 | 56.379 | 5.555 | 6.159 | 1.352 | 2.115 | 4.044 | -1.515 | 55.127 | .088 | 3.694 | 58.908 |
| 1968 | 54.306 | .142 | 3.778 | 58.225 | 6.213 | 6.905 | 1.380 | 1.998 | 4.907 | -.712 | 58.502 | .142 | 3.778 | 62.419 |
| 1969 | 56.286 | .154 | 4.102 | 60.541 | 6.903 | 7.676 | 1.534 | 2.126 | 5.551 | -.471 | 61.362 | .154 | 4.102 | 65.621 |
| 1970 | 59.186 | .239 | 4.076 | 63.501 | 7.470 | 8.342 | 1.936 | 2.632 | 5.709 | -1.367 | 63.522 | .239 | 4.076 | 67.844 |
| 1971 | 58.042 | .413 | 4.268 | 62.723 | 8.540 | 9.535 | 1.546 | 2.151 | 7.384 | -.818 | 64.596 | .413 | 4.268 | 69.289 |
| 1972 | 58.938 | .584 | 4.398 | 63.920 | 10.299 | 11.387 | 1.531 | 2.118 | 9.269 | -.485 | 67.696 | .584 | 4.398 | 72.704 |
| 1973 | 58.241 | .910 | 4.433 | 63.585 | 13.466 | 14.613 | 1.425 | 2.033 | 12.580 | -.456 | 70.316 | .910 | 4.433 | 75.708 |
| 1974 | 56.331 | 1.272 | 4.769 | 62.372 | 13.127 | 14.304 | 1.620 | 2.203 | 12.101 | -.482 | 67.906 | 1.272 | 4.769 | 73.991 |
| 1975 | 54.733 | 1.900 | 4.723 | 61.357 | 12.948 | 14.032 | 1.761 | 2.323 | 11.709 | -1.067 | 65.355 | 1.900 | 4.723 | 71.999 |
| 1976 | 54.723 | 2.111 | 4.768 | 61.602 | 15.672 | 16.760 | 1.597 | 2.172 | 14.588 | -.178 | 69.104 | 2.111 | 4.768 | 76.012 |
| 1977 | 55.101 | 2.702 | 4.249 | 62.052 | 18.756 | 19.948 | 1.442 | 2.052 | 17.896 | -1.948 | 70.989 | 2.702 | 4.249 | 78.000 |
| 1978 | 55.074 | 3.024 | 5.039 | 63.137 | 17.824 | 19.106 | 1.078 | 1.920 | 17.186 | -.337 | 71.856 | 3.024 | 5.039 | 79.986 |
| 1979 | 58.006 | 2.776 | 5.166 | 65.948 | 17.933 | 19.460 | 1.753 | 2.855 | 16.605 | -1.649 | 72.892 | 2.776 | 5.166 | 80.903 |
| 1980 | 59.008 | 2.739 | 5.485 | 67.232 | 14.658 | 15.796 | 2.421 | 3.695 | 12.101 | -1.212 | 69.826 | 2.739 | 5.485 | 78.122 |
| 1981 | 58.529 | 3.008 | 5.477 | 67.014 | 12.639 | 13.719 | 2.944 | 4.307 | 9.412 | -.258 | 67.570 | 3.008 | 5.477 | 76.168 |
| 1982 | 57.458 | 3.131 | 6.034 | 66.623 | 10.777 | 11.861 | 2.787 | 4.608 | 7.253 | -.724 | 63.888 | 3.131 | 6.034 | 73.153 |
| 1983 | 54.416 | 3.203 | 6.561 | 64.180 | 10.647 | 11.752 | 2.045 | 3.693 | 8.059 | .799 | 63.154 | 3.203 | 6.561 | 73.038 |
| 1984 | 58.849 | 3.553 | 6.522 | 68.924 | 11.433 | 12.471 | 2.151 | 3.786 | 8.685 | -.894 | 66.504 | 3.553 | 6.522 | 76.714 |
| 1985 | 57.539 | 4.076 | 6.185 | 67.799 | 10.609 | 11.781 | 2.438 | 4.196 | 7.584 | 1.107 | 66.091 | 4.076 | 6.185 | 76.491 |
| 1986 | 56.575 | 4.380 | 6.223 | 67.178 | 13.201 | 14.151 | 2.248 | 4.021 | 10.130 | -.552 | 66.031 | 4.380 | 6.223 | 76.756 |
| 1987 | 57.167 | 4.754 | 5.739 | 67.659 | 14.162 | 15.398 | 2.093 | 3.812 | 11.586 | -.073 | 68.522 | 4.754 | 5.739 | 79.173 |
| 1988 | 57.875 | 5.587 | 5.568 | 69.030 | 15.747 | 17.296 | 2.499 | 4.366 | 12.929 | .860 | 71.556 | 5.587 | 5.568 | 82.819 |
| 1989 | 57.483 | 5.602 | 6.391 | 69.476 | 17.162 | 18.766 | 2.637 | 4.661 | 14.105 | 1.362 | 72.913 | 5.602 | 6.391 | 84.944 |
| 1990 | 58.560 | 6.104 | 6.206 | 70.870 | 17.117 | 18.817 | 2.772 | 4.752 | 14.065 | -.283 | 72.333 | 6.104 | 6.206 | 84.652 |
| 1991 | 57.872 | 6.422 | 6.238 | 70.532 | 16.348 | 18.335 | 2.854 | 5.141 | 13.194 | .881 | 71.880 | 6.422 | 6.238 | 84.607 |
| 1992 | 57.655 | 6.479 | 5.993 | 70.127 | 16.968 | 19.372 | 2.682 | 4.937 | 14.435 | 1.394 | 73.397 | 6.479 | 5.993 | 85.956 |
| 1993 | 55.822 | 6.410 | 6.263 | 68.495 | 18.510 | 21.273 | 1.962 | 4.258 | 17.014 | 2.094 | 74.836 | 6.410 | 6.262 | 87.603 |
| 1994 | 58.044 | 6.694 | 6.155 | 70.893 | 19.243 | 22.390 | 1.879 | 4.061 | 18.329 | .038 | 76.258 | 6.694 | 6.155 | 89.260 |
| 1995 | 57.540 | 7.075 | 6.703 | 71.319 | 18.881 | 22.260 | 2.318 | 4.511 | 17.750 | 2.104 | 77.258 | 7.075 | 6.705 | 91.173 |
| 1996 | 58.387 | 7.087 | 7.167 | 72.641 | 20.284 | 23.702 | 2.368 | 4.633 | 19.069 | 2.466 | 79.783 | 7.087 | 7.168 | 94.175 |
| 1997 | 58.857 | 6.597 | 7.180 | 72.634 | 21.740 | 25.215 | 2.193 | 4.514 | 20.701 | 1.430 | 80.874 | 6.597 | 7.178 | 94.765 |
| 1998 | 59.314 | 7.068 | 6.659 | 73.041 | 22.908 | 26.581 | 2.092 | 4.299 | 22.281 | -.139 | 81.370 | 7.068 | 6.657 | 95.183 |
| 1999 | 57.614 | 7.610 | 6.683 | 71.907 | 23.133 | 27.252 | 1.525 | 3.715 | 23.537 | 1.373 | 82.428 | 7.610 | 6.681 | 96.817 |
| 2000 | 57.366 | 7.862 | 6.262 | 71.490 | 24.531 | 28.973 | 1.528 | 4.006 | 24.967 | 2.518 | 84.733 | 7.862 | 6.264 | 98.975 |
| 2001 | 58.541 | 8.033 | 5.318 | 71.892 | 25.398 | 30.157 | 1.265 | 3.770 | 26.386 | -1.952 | 82.903 | 8.033 | 5.316 | 96.326 |
| 2002 | 56.894 | 8.143 | 5.899 | 70.936 | 24.674 | 29.407 | 1.032 | 3.668 | 25.739 | 1.184 | 83.750 | 8.143 | 5.893 | 97.858 |
| 2003 | 56.157 | 7.959 | 6.149 | 70.264 | 26.219 | 31.061 | 1.117 | 4.054 | 27.007 | .938 | 84.078 | 7.959 | 6.150 | 98.209 |
| 2004 | 55.914 | 8.222 | 6.248 | 70.384 | 28.196 | 33.543 | 1.253 | 4.433 | 29.110 | .857 | 85.830 | 8.222 | 6.261 | 100.351 |
| 2005 | 55.056 | 8.160 | 6.431 | 69.647 | 29.248 | 34.710 | 1.273 | 4.561 | 30.149 | .710 | 85.817 | 8.160 | 6.444 | 100.506 |
| 2006 | 55.940 | 8.214 | 6.872 | 71.025 | 29.168 | 34.673 | 1.264 | 4.868 | 29.805 | -.974 | 84.658 | 8.214 | 6.922 | 99.856 |
| 2007P | 56.499 | 8.415 | 6.800 | 71.713 | 28.701 | 34.599 | 1.507 | 5.361 | 29.238 | .649 | 86.248 | 8.415 | 6.830 | 101.600 |
Primary Energy Consumption by Source, 1635-1945
Historically, wood served as the preeminent form of energy for about half of the US’s history. Around 1885, coal surpassed wood’s usage. Despite its tremendous and rapid expansion, coal was, in turn, overtaken by petroleum in the middle of the 20th century. Natural gas, too, experienced rapid development into the second half of the 20th century, and coal began to expand again. Late in the 20th century still another form of energy, nuclear electric power, was developed and made significant contributions. The table below illustrates the (estimated) Primary Energy Consumption in the United States, Selected Years, 1635-1945 in Quadrillion Btu.

| Primary Energy Data, 1635-1945 (Quadrillion Btu) | ||||||||||||||
|---|---|---|---|---|---|---|---|---|---|---|---|---|---|---|
| Year | Fossil Fuels | Renewable Energy | Electricity Net Imports | Total | ||||||||||
| Coal | Natural Gas | Petroleum | Total | Conventional Hydroelectric Power | Biomass | Total | ||||||||
| Wood (1) | ||||||||||||||
| 1635 | 0 | 0 | 0 | 0 | 0 | 0 | 0 | 0 | 0 | |||||
| 1645 | 0 | 0 | 0 | 0 | 0 | 0.001 | 0.001 | 0 | 0.001 | |||||
| 1655 | 0 | 0 | 0 | 0 | 0 | .002 | .002 | 0 | .002 | |||||
| 1665 | 0 | 0 | 0 | 0 | 0 | .005 | .005 | 0 | .005 | |||||
| 1675 | 0 | 0 | 0 | 0 | 0 | .007 | .007 | 0 | .007 | |||||
| 1685 | 0 | 0 | 0 | 0 | 0 | .009 | .009 | 0 | .009 | |||||
| 1695 | 0 | 0 | 0 | 0 | 0 | .014 | .014 | 0 | .014 | |||||
| 1705 | 0 | 0 | 0 | 0 | 0 | .022 | .022 | 0 | .022 | |||||
| 1715 | 0 | 0 | 0 | 0 | 0 | .037 | .037 | 0 | .037 | |||||
| 1725 | 0 | 0 | 0 | 0 | 0 | .056 | .056 | 0 | .056 | |||||
| 1735 | 0 | 0 | 0 | 0 | 0 | .080 | .080 | 0 | .080 | |||||
| 1745 | 0 | 0 | 0 | 0 | 0 | .112 | .112 | 0 | .112 | |||||
| 1755 | 0 | 0 | 0 | 0 | 0 | .155 | .155 | 0 | .155 | |||||
| 1765 | 0 | 0 | 0 | 0 | 0 | .200 | .200 | 0 | .200 | |||||
| 1775 | 0 | 0 | 0 | 0 | 0 | .249 | .249 | 0 | .249 | |||||
| 1785 | 0 | 0 | 0 | 0 | 0 | .310 | .310 | 0 | .310 | |||||
| 1795 | 0 | 0 | 0 | 0 | 0 | .402 | .402 | 0 | .402 | |||||
| 1805 | 0 | 0 | 0 | 0 | 0 | .537 | .537 | 0 | .537 | |||||
| 1815 | 0 | 0 | 0 | 0 | 0 | .714 | .714 | 0 | .714 | |||||
| 1825 | 0 | 0 | 0 | 0 | 0 | .960 | .960 | 0 | .960 | |||||
| 1835 | 0 | 0 | 0 | 0 | 0 | 1.305 | 1.305 | 0 | 1.305 | |||||
| 1845 | 0 | 0 | 0 | 0 | 0 | 1.757 | 1.757 | 0 | 1.757 | |||||
| 1850 | 0.219 | 0 | 0 | 0.219 | 0 | 2.138 | 2.138 | 0 | 2.357 | |||||
| 1855 | .421 | 0 | 0 | .421 | 0 | 2.389 | 2.389 | 0 | 2.810 | |||||
| 1860 | .518 | 0 | 0.003 | .521 | 0 | 2.641 | 2.641 | 0 | 3.162 | |||||
| 1865 | .632 | 0 | .010 | .642 | 0 | 2.767 | 2.767 | 0 | 3.409 | |||||
| 1870 | 1.048 | 0 | .011 | 1.059 | 0 | 2.893 | 2.893 | 0 | 3.952 | |||||
| 1875 | 1.440 | 0 | .011 | 1.451 | 0 | 2.872 | 2.872 | 0 | 4.323 | |||||
| 1880 | 2.054 | 0 | .096 | 2.150 | 0 | 2.851 | 2.851 | 0 | 5.001 | |||||
| 1885 | 2.840 | 0.082 | .040 | 2.962 | 0 | 2.683 | 2.683 | 0 | 5.645 | |||||
| 1890 | 4.062 | .257 | .156 | 4.475 | 0.022 | 2.515 | 2.537 | 0 | 7.012 | |||||
| 1895 | 4.950 | .147 | .168 | 5.265 | .090 | 2.306 | 2.396 | 0 | 7.661 | |||||
| 1900 | 6.841 | .252 | .229 | 7.322 | .250 | 2.015 | 2.265 | 0 | 9.587 | |||||
| 1905 | 10.001 | .372 | .610 | 10.983 | .386 | 1.843 | 2.229 | 0 | 13.212 | |||||
| 1910 | 12.714 | .540 | 1.007 | 14.261 | .539 | 1.765 | 2.304 | 0 | 16.565 | |||||
| 1915 | 13.294 | .673 | 1.418 | 15.385 | .659 | 1.688 | 2.347 | 0.002 | 17.734 | |||||
| 1920 | 15.504 | .813 | 2.676 | 18.993 | .738 | 1.610 | 2.348 | .003 | 21.344 | |||||
| 1925 | 14.706 | 1.191 | 4.280 | 20.177 | .668 | 1.533 | 2.201 | .004 | 22.382 | |||||
| 1930 | 13.639 | 1.932 | 5.897 | 21.468 | .752 | 1.455 | 2.207 | .005 | 23.680 | |||||
| 1935 | 10.634 | 1.919 | 5.675 | 18.228 | .806 | 1.397 | 2.203 | .005 | 20.436 | |||||
| 1940 | 12.535 | 2.665 | 7.760 | 22.960 | .880 | 1.358 | 2.238 | .007 | 25.205 | |||||
| 1945 | 15.972 | 3.871 | 10.110 | 29.953 | 1.442 | 1.261 | 2.703 | .009 | 32.665 | |||||
World Primary Energy Production by Region, 1996-2005
- 1 Excludes countries that were part of the former U.S.S.R.
- Notes:
- Data in this table do not include recent updates for the United States or for other countries
- World primary energy production includes production of crude oil (including lease condensate), natural gas plant liquids, dry natural gas, and coal; and net electricity generation from nuclear electric power, hydroelectric power, wood, waste, geothermal, solar, and wind. Data for the United States also include other renewable energy.
- Totals may not equal sum of components due to independent rounding.
- 2 Includes only countries that were part of the former U.S.S.R. For related information, see http://www.eia.doe.gov/international.
- R=Revised.
- P=Preliminary.
- Source: Energy Information Administration, "International Energy Annual 2005" (June-October 2007).
| Region_Country | 1996 | 1997 | 1998 | 1999 | 2000 | 2001 | 2002 | 2003 | 2004 | 2005 |
|---|---|---|---|---|---|---|---|---|---|---|
| North_Central_and_South_America | 121.08 | 123.27 | 124.52 | 123.12 | 125 | 125.67 | 125.65 | 124.62 | 126.7 | 127.35 |
| Brazil | 4.83 | 5.06 | 5.48 | 5.91 | 6.4 | 6.2 | 6.75 | 7.1 | 7.19 | 7.71 |
| Canada | 17.22 | 17.48 | 17.43 | 17.68 | 18.12 | 18.25 | 18.57 | 18.5 | 18.87 | 19.09 |
| Mexico | 8.75 | 9.06 | 9.31 | 9.06 | 9.34 | 9.54 | 10.81 | 10.08 | 10.28 | 10.26 |
| United_States | 72.64 | 72.63 | 73.04 | 71.91 | 71.49 | 71.89 | 70.94 | 70.27 | 70.39 | 69.64 |
| Venezuela | 8.62 | 9.48 | 9.45 | 8.54 | 9.37 | 9.23 | 8.16 | 7.32 | 8.06 | 8.23 |
| Other | 9.02 | 9.56 | 9.82 | 10.04 | 10.27 | 10.57 | 10.43 | 11.35 | 11.9 | 12.42 |
| Europe | 51.86 | 51.77 | 50.7 | 51.09 | 50.89 | 51.49 | 51.27 | 50.74 | 50.7 | 49.13 |
| France | 5.03 | 4.92 | 4.78 | 4.92 | 5.02 | 5.14 | 5.13 | 5.15 | 5.17 | 5.1 |
| Germany | 5.49 | 5.57 | 5.26 | 5.31 | 5.32 | 5.28 | 5.3 | 5.29 | 5.41 | 5.3 |
| Netherlands | 3.25 | 2.88 | 2.77 | 2.56 | 2.47 | 2.63 | 2.62 | 2.53 | 2.94 | 2.71 |
| Norway | 9.26 | 9.59 | 9.33 | 9.53 | 10.27 | 10.28 | 10.69 | 10.64 | 10.75 | 10.66 |
| Poland | 3.83 | 3.83 | 3.36 | 3.5 | 3.06 | 3.08 | 3.08 | 3.08 | 3.06 | 2.98 |
| United_Kingdom | 11.56 | 11.33 | 11.53 | 11.89 | 11.09 | 11.14 | 10.99 | 10.62 | 9.55 | 8.73 |
| Other | 13.44 | 13.65 | 13.68 | 13.38 | 13.66 | 13.94 | 13.47 | 13.43 | 13.83 | 13.65 |
| Eurasia | 52.27 | 50.79 | 51.02 | 53.45 | 56 | 57.94 | 59.67 | 63.53 | 66.76 | 68.6 |
| Kazakhstan | 2.41 | 2.47 | 2.43 | 2.63 | 3.32 | 3.69 | 3.98 | 4.41 | 5.08 | 5.48 |
| Russia | 41.68 | 40.63 | 40.95 | 42.64 | 43.6 | 44.77 | 46.13 | 49.11 | 51.6 | 52.72 |
| Ukraine | 3.03 | 3.01 | 3.03 | 3.08 | 3.07 | 3.08 | 3.07 | 3.22 | 3.22 | 3.21 |
| Other | 5.14 | 4.68 | 4.61 | 5.1 | 6.01 | 6.41 | 6.49 | 6.8 | 6.86 | 7.2 |
| Middle_East | 49.43 | 51.72 | 54.88 | 53.8 | 57.48 | 56.16 | 54.24 | 57.58 | 62.15 | 65.22 |
| Iran | 9.65 | 9.84 | 9.9 | 10 | 10.4 | 10.67 | 10.45 | 11.36 | 12.06 | 13.01 |
| Iraq | 1.39 | 2.6 | 4.71 | 5.47 | 5.62 | 5.22 | 4.42 | 2.84 | 4.38 | 4.11 |
| Kuwait | 4.94 | 4.85 | 5.02 | 4.6 | 5.04 | 4.81 | 4.58 | 5.14 | 5.71 | 6.12 |
| Saudi_Arabia | 20.82 | 21.24 | 21.42 | 20.18 | 21.59 | 20.95 | 20.27 | 23.05 | 24.16 | 25.51 |
| United Arab Emirates | 6.34 | 6.5 | 6.61 | 6.25 | 6.77 | 6.59 | 6.5 | 7.13 | 7.42 | 7.59 |
| Other | 6.3 | 6.69 | 7.24 | 7.29 | 8.06 | 7.92 | 8.02 | 8.05 | 8.42 | 8.89 |
| Africa | 24.64 | 26.09 | 26.27 | 26.57 | 27.78 | 28.01 | 28.04 | 30.15 | 32.05 | 34.66 |
| Algeria | 5.28 | 5.63 | 5.75 | 6.03 | 6.29 | 6.26 | 6.3 | 7 | 7.14 | 7.7 |
| Libya | 3.28 | 3.39 | 3.26 | 3.07 | 3.3 | 3.21 | 3.11 | 3.3 | 3.61 | 4 |
| Nigeria | 4.56 | 4.85 | 4.9 | 4.89 | 5.18 | 5.45 | 5.16 | 5.71 | 5.9 | 6.55 |
| South_Africa | 4.86 | 5.44 | 5.52 | 5.43 | 5.58 | 5.62 | 5.52 | 5.91 | 6.06 | 6.05 |
| Other | 6.66 | 6.79 | 6.83 | 7.15 | 7.44 | 7.47 | 7.94 | 8.22 | 9.33 | 10.37 |
| Asia_and_Oceania | 73.97 | 77.84 | 77.64 | 77.96 | 79.11 | 83.92 | 88.07 | 96.08 | 106.1 | 115.16 |
| Australia | 7.59 | 8.32 | 8.67 | 8.86 | 9.68 | 10.26 | 10.51 | 10.35 | 10.56 | 11.23 |
| China | 35.78 | 37.97 | 36.67 | 35.71 | 35.34 | 38.48 | 42.22 | 49.02 | 56.38 | 63.23 |
| India | 8.75 | 9.17 | 9.37 | 9.58 | 9.83 | 10.29 | 10.04 | 10.6 | 11.24 | 11.73 |
| Indonesia | 7.42 | 7.41 | 7.56 | 8.02 | 7.87 | 8.09 | 8.32 | 8.55 | 8.93 | 9.32 |
| Japan | 4.23 | 4.48 | 4.59 | 4.37 | 4.41 | 4.38 | 4.07 | 3.68 | 4.16 | 4.1 |
| Malaysia | 2.84 | 3.01 | 3.14 | 3.16 | 3.21 | 3.31 | 3.44 | 3.84 | 4.09 | 3.9 |
| Other | 7.36 | 7.48 | 7.65 | 8.26 | 8.78 | 9.1 | 9.49 | 10.06 | 10.74 | 11.66 |
| World | 373.24 | 381.49 | 385.03 | 385.99 | 396.26 | 403.19 | 406.94 | 422.69 | 444.45 | 460.14 |
Other Energy Production and Consumption Data
World Crude Oil Production, 1960-2007
World Petroleum Consumption, 1960-2006
Annual Energy Outlook 2008 with Projections to 2030
- SOCR Home page: http://www.socr.ucla.edu
Translate this page:
