SOCR Data US Elections Counties2004
From Socr
Contents |
SOCR Data - Popular vs. Electoral Vote in US Presidential Elections (1828-2008)
Data Description
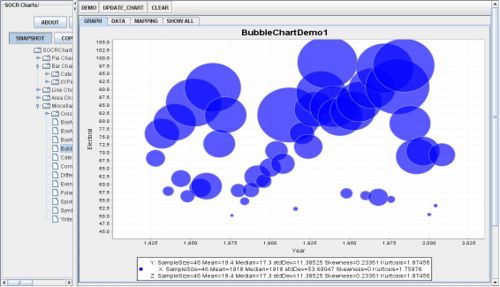
These data represent the margin of victory in the popular vote in percentage points (e.g., explanatory variable) vs the margin of victory in the Electoral College in percentage points (e.g., response variable) for the winner in all Presidential Elections since 1828.
Source
Data Table
| NAME | STATE_NAME | STATE_FIPS | CNTY_FIPS | PCountyFIPS | Bush | Kerry | Nader | Total | Bush_pct | Kerry_pct | Nader_pct | MDratio | hosp | pcthisp | pcturban | urbrural | pctfemhh | pcincome | pctpoor | pctlt9ed | pcthsed | pctcoled | unemploy | pctwhtcl | homevalu | rent | popdens | crowded | ginirev | SmokecurM | SmokevrM | SmokecurF | SmokevrF | Obese | Noins | XYLENES__M | TOLUENE | TETRACHLOR | STYRENE | NICKEL_COM | METHYLENE_ | MERCURY_CO | LEAD_COMPO | BENZENE__I | ARSENIC_CO | POP2000 | POP00SQMIL | MALE2000 | FEMALE2000 | MAL2FEM | UNDER18 | AIAN | ASIA | BLACK | NHPI | WHITE | AIAN_MORE | ASIA_MORE | BLK_MORE | NHPI_MORE | WHT_MORE | HISP_LAT | CH19902000 | MEDAGE2000 | PEROVER65 |
|---|
Example: Bubble Chart
You can paste these data in any of the SOCR Analyses or Charts to obtain quantitative results of explore the data graphically. For instance, you can paste these data in the SOCR Bubble Chart, map the variables (Year --> X, ElectoralVote --> Y, Diff(Popular-Electoral)Vote --> Z) and click UPDATE Graph to obtain the image below. Notice how the close elections are represented by smaller bubbles near the 50% of the electoral vote line, as the difference between the popular and the electoral votes for tight elections are small.

- SOCR Home page: http://www.socr.ucla.edu
Translate this page:

