SOCR EduMaterials Activities BetaCoinExperiment
From Socr
Contents |
Beta Coin Experiment
Description
The Beta Coin Experiment is a random experiment that involves tossing a coin, where the probability of heads is p, n times. The probability of heads is modeled with a prior beta distribution, having parameters a and b. On each update, the number of heads Y is recorded in the data table to the left as well as the Bayesian estimate of p given by the equation, U = (a + Y) / (a + b + n). The second table gives the true distBias and mean square error of U, and the updated cumulative empirical distBias and mean square error of the experiment. The graph on the right displays the prior density and the true probability of heads are shown in blue and the posterior beta density is shown in red. Parameters n, p, a, and b can be varied with the scroll bars above.
Goal
To provide an accessible simulation when determining the effects of manipulating the probability of two quantitative variables (e.g. heads/tails, success/failure, hot/cold, etc.) from a population and to obtain knowledge of the Bayesian estimate numerically and graphically.
Experiment
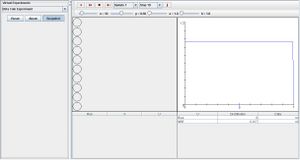
Go to the SOCR Experiment [[1]] and select the Beta Coin Experiment from the drop-down list of experiments on the top left. The image below shows the initial view of this experiment:

When pressing the play button, one trial will be executed and recorded in the distribution table below. The fast forward button symbolizes the nth number of trials to be executed each time. The stop button ceases any activity and is helpful when the experimenter chooses “continuous,” indicating an infinite number of events. The fourth button will reset the entire experiment, deleting all previous information and data collected. The “update” scroll indicates nth number of trials (1, 10, 100, or 1000) performed when selecting the fast forward button and the “stop” scroll indicates the maximum number of trials in the experiment.
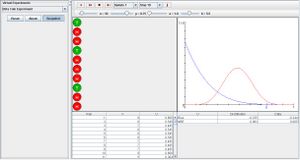
When increasing parameter a, the left side of the prior beta density and probability of heads (shown in blue) will decrease and increasing parameter b also decreases the prior beta density and probability of heads, but on the right side. When shifting probability p, the posterior beta density moves with p as the center of the red graph is positioned at p. Increasing the value of n will cause the posterior beta graph to become more normal. The image below displays an experiment after many trials under the conditions of having a large p value and large b value:

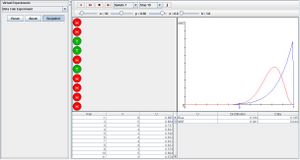
The image below is of an experiment with a small n value and large a value:

Applications
The Beta Coin Experiment demonstrates the behaviors of subjective probability, personal probability, frequency probability and logical probability. It may be used to test different hypotheses and collect new information when conducting an experiment.
Translate this page:
