SOCR EduMaterials Activities CouponCollectorExperiment
From Socr
Contents |
Coupon Collector Experiment
Description
From the population with interval {1, ..., m}, a sample of k distinct values are obtained with replacement.
Random variable W gives the sample size and is recorded in the first table on each update and the density and moments of W are recorded in the second table. The empirical density and moments of W are also recorded in the second table on each update.
The first graph gives the counts for each population value that occurred in the sample. In the second graph, the density and moments of W are shown in blue and the empirical density and moments of W are shown in red.
The parameters m and k can be modified with the scroll bars above the graphs.
Goal
To provide a demonstration illustrating events involving random sampling with replacement. Users should obtain a general understanding of the outcomes of these types of experiments and begin to apply it to other purposes.
Experiments
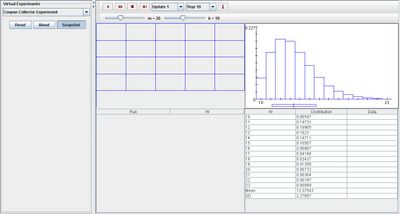
Go to the SOCR Experiment [[1]] and select the Coupon Collector Experiment from the drop-down list of experiments on the top left. The image below shows the initial view of this experiment:

When pressing the play button, one trial will be executed and recorded in the distribution table below. The fast forward button symbolizes the nth number of trials to be executed each time. The stop button ceases any activity and is helpful when the experimenter chooses “continuous,” indicating an infinite number of events. The fourth button will reset the entire experiment, deleting all previous information and data collected. The “update” scroll indicates nth number of trials (1, 10, 100, or 1000) performed when selecting the fast forward button and the “stop” scroll indicates the maximum number of trials in the experiment.
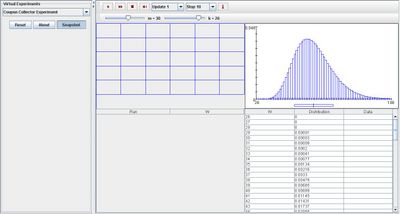
Notice that when parameter k varies, the spread of the graph varies in such a way that the larger k is, the larger the spread is. Thus, the graph will obtain a smoother curve. The image below describes this characteristic of the experiment:

Parameter k also changes with respect to the modification of parameter m. When m is increased, k is decreased, and when m is decreased, k is increased. Be aware that when k reaches a value of 1, it no longer moves on its own and will remain at the value of 1.
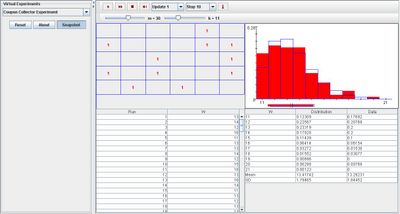
As the number of trials increase, the apparent convergence of the relative frequency distribution to the true distribution is shown below:

On each update, the data and distribution table will change accordingly. At the bottom of the distribution table, the mean and standard deviation value, which provides the experimenter more information regarding the sampling with replacement, are also updated.
Applications
The Coupon Collector Experiment may be applied to any situation regarding a random sample with replacement from a population of interest that generates a sequence of independent random variables, each uniformly distributed.
For instance, sampling cards from a typical 52 deck of cards, where each card consists of the same likelihood of being chosen at random.
Suppose a scientist randomly selects a beaker from a box with m beakers of k different sizes. Using the java applet will show the probability of selecting a beaker of the correct amount for his experiment.
Translate this page:
