SOCR EduMaterials Activities Discrete Probability examples
From Socr
Create90215 (Talk | contribs) |
Create90215 (Talk | contribs) |
||
| Line 41: | Line 41: | ||
<center>[[Image: SOCR_Activities_Binomial_Christou_example6_b_n=3.jpg|600px]]</center> | <center>[[Image: SOCR_Activities_Binomial_Christou_example6_b_n=3.jpg|600px]]</center> | ||
* '''Example 7:''' | * '''Example 7:''' | ||
| + | Construct a probability histogram for the binomial probability distribution for each of the following: n=5,p=0.1, n=5,p=0.5, m=5,n=0.9. What do you observe? Explain. | ||
| + | * '''Answer:''' | ||
| + | We observe that if p=0.5 the distribution resembles the normal distribution, with mean <math>np=0.25</math>. Values above and below the mean are distributed symmetrically around the mean. Also, the probability histograms for p=0.1 and p=0.9 are mirror images of each other. | ||
<center>[[Image: SOCR_Activities_Binomial_Christou_example7_p=1.jpg|600px]]</center> | <center>[[Image: SOCR_Activities_Binomial_Christou_example7_p=1.jpg|600px]]</center> | ||
<center>[[Image: SOCR_Activities_Binomial_Christou_example6_b_n=5.jpg|600px]]</center> | <center>[[Image: SOCR_Activities_Binomial_Christou_example6_b_n=5.jpg|600px]]</center> | ||
<center>[[Image: SOCR_Activities_Binomial_Christou_example6_b_n=9.jpg|600px]]</center> | <center>[[Image: SOCR_Activities_Binomial_Christou_example6_b_n=9.jpg|600px]]</center> | ||
| + | * '''Example 8:''' | ||
| + | On a population of consumers, 60% prefer a certain brand of ice cream. If consumers are randomly selected, | ||
| + | **a. what is the probability that exactly 3 people have to be interviewed to encounter the first consumer who prefers this brand of ice cream? | ||
| + | **b. what is the probability that at least 3 people have to be interviewed to encounter the first consumer who prefers this brand of ice cream? | ||
| + | * '''Answer:''' | ||
| + | **a. <math>P(X=3)=P(The first consumer does not prefer this new brand) \times P(The second consumer does not prefer this new brand) \times P(The third consumer does prefer this new brand)= 0.4 \times 0.4 \times 0.6=0.096</math> | ||
| + | **b. Let's first find the probability that at least 3 people will NOT have to be interviewed to encounter the first case. | ||
| + | <math>P(X=1) + P(X=2) = 0.6+0.4 \times 0.6 = 0.84</math> | ||
| + | *Now we subtract this from 1 to find the complement: | ||
| + | <math>1-0.84= 0.16</math> | ||
| + | * '''Example 9:''' | ||
Revision as of 23:19, 29 April 2007
- Description: You can access the applets for the distributions at http://www.socr.ucla.edu/htmls/SOCR_Distributions.html .
- Example 1:
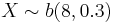
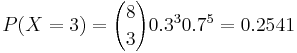
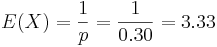
Find the probability that 3 out of 8 plants will survive a frost, given that any such plant will survive a frost with probability of 0.30. Also, find the probability that at least 1 out of 8 will survive a frost. What is the expected value and standard deviation of the number of plants that survive the frost?
- Answer:
 ,
, 


Below you can see SOCR snapshots for this example:


- Example 2:
If the probabilities of having a male or female offspring are both 0.50, find the probability that a familiy's fifth child is their first son.
- Answer:
- P(X = 5) = 0.505 = 0.03125

- Example 3:
- a.
 ,
, 
- a.

- b.
- b.

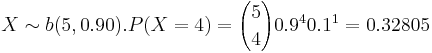
- Example 4:
- P(X = 5) = 0.740.3 = 0.07203 where X represents the number of trials.

- Example 5:
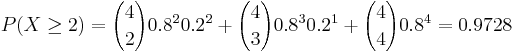
- Example 6:
- a.
- a.


- b. P(X = 0) = .001,0.001 = 0.1nn = 3.
- In the first snapshot below, where
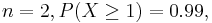 which is too small. In the second snapshot, we can see that when n is increased to 3,
  increases to nearly 1.


- Example 7:
Construct a probability histogram for the binomial probability distribution for each of the following: n=5,p=0.1, n=5,p=0.5, m=5,n=0.9. What do you observe? Explain.
- Answer:
We observe that if p=0.5 the distribution resembles the normal distribution, with mean np = 0.25. Values above and below the mean are distributed symmetrically around the mean. Also, the probability histograms for p=0.1 and p=0.9 are mirror images of each other.

- Example 8:
On a population of consumers, 60% prefer a certain brand of ice cream. If consumers are randomly selected,
- a. what is the probability that exactly 3 people have to be interviewed to encounter the first consumer who prefers this brand of ice cream?
- b. what is the probability that at least 3 people have to be interviewed to encounter the first consumer who prefers this brand of ice cream?
- Answer:
- a.

- b. Let's first find the probability that at least 3 people will NOT have to be interviewed to encounter the first case.
- a.

- Now we subtract this from 1 to find the complement:
1 − 0.84 = 0.16
- Example 9:
