SOCR EduMaterials Activities Explore Distributions
From Socr
(Difference between revisions)
(→This is an activity to explore the relations among some of the commonly used probability distributions.) |
|||
| Line 3: | Line 3: | ||
* '''Description''': You can access the applets for the above distributions at http://www.socr.ucla.edu/htmls/SOCR_Distributions.html . | * '''Description''': You can access the applets for the above distributions at http://www.socr.ucla.edu/htmls/SOCR_Distributions.html . | ||
| - | * '''Geometric probability distribution:''' Let's roll two dice until a sum of 10 is obtained. What | + | * '''Geometric probability distribution:''' Let's roll two dice until a sum of 10 is obtained. What is the probability that the first sum of 10 will occur after the 5th trial? The answer to this question is <math> P(X>5)=(1-\frac{3}{36})^5=0.6472. </math>. This is equivalent to the event that no sum of 10 is observed on the first 5 trials (5 failures). Now, using SOCR we can obtain this probability easily by entering in the SOCR geometric distribution applet <math> p=\frac{3}{36}=0.0833 </math> and in the Right Cut-Off box 5. We can find the desire probability on the right corner of the applet. The figure below clearly displays this probability. |
<center>[[Image: SOCR_Activities_ExploreDistributions_Christou_figure1.jpg|600px]]</center> | <center>[[Image: SOCR_Activities_ExploreDistributions_Christou_figure1.jpg|600px]]</center> | ||
Revision as of 23:59, 23 March 2007
This is an activity to explore the relations among some of the commonly used probability distributions.
- Description: You can access the applets for the above distributions at http://www.socr.ucla.edu/htmls/SOCR_Distributions.html .
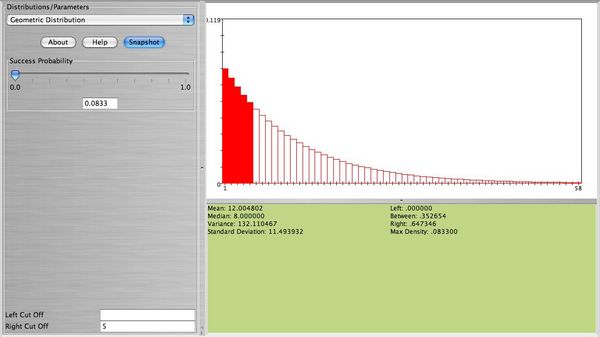
- Geometric probability distribution: Let's roll two dice until a sum of 10 is obtained. What is the probability that the first sum of 10 will occur after the 5th trial? The answer to this question is
 . This is equivalent to the event that no sum of 10 is observed on the first 5 trials (5 failures). Now, using SOCR we can obtain this probability easily by entering in the SOCR geometric distribution applet
  and in the Right Cut-Off box 5. We can find the desire probability on the right corner of the applet. The figure below clearly displays this probability.

Use SOCR to graph and print the following distributions and answer the questions below. Also, comment on the shape of each one of these distributions:
- a.
 , find P(X = 3), E(X), sd(X), and verify them with the formulas discussed in class.
- b.
 , find
  .
.
- c.
 , find
  .
.
- d.
 , find P(X > 2).
- a.
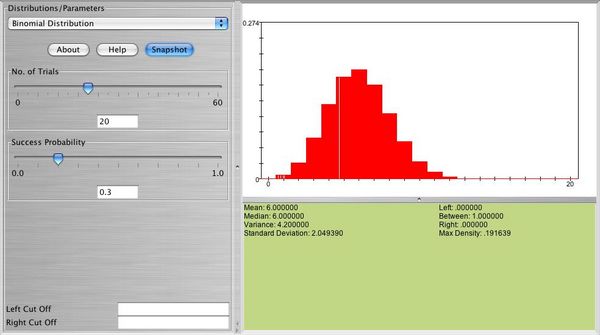
Below you can see a snapshot of the distribution of 

- Exercise 2: Use SOCR to graph and print the distribution of a geometric random variable with p = 0.2,p = 0.7. What is the shape of these distributions? What happens when p is large? What happens when p is small?
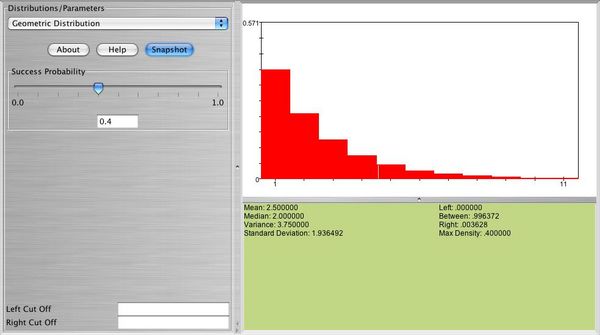
Below you can see a snapshot of the distribution of 

- Exercise 3: Select the geometric probability distribution with p = 0.2. Use SOCR to compute the following:
- a. P(X = 5)
- b. P(X > 3)
- c.

- d. P(X > 6)
- e.

- f.

- g. P(4 < X < 9)
- Exercise 4: Verify that your answers in exercise 3 agree with the formulas discussed in class, for example, P(X = x) = (1 − p)x − 1p, P(X > k) = (1 − p)k, etc. Write all your answers in detail using those formulas.
- Exercise 5: Let X follow the hypergeometric probability distribution with N = 52, n = 10, and number of "hot" items 13. Use SOCR to graph and print this distribution.
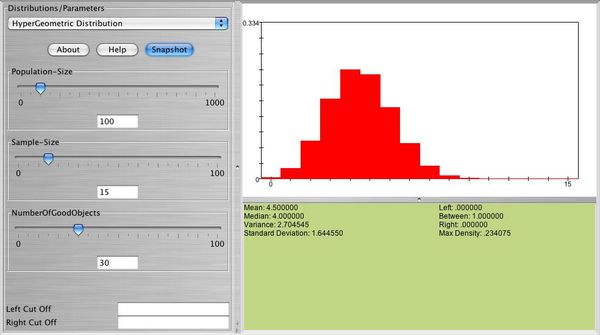
Below you can see a snapshot of the distribution of 

- Exercise 6: Refer to exercise 5. Use SOCR to compute P(X = 5) and write down the formula that gives this answer.
- Exericise 7: Binomial approximation to hypergeometric: Let X follow the hypergeometric probability distribution with
 and number of "hot" items 50. Graph and print this distribution.
- Exercise 8: Refer to exerciise 7. Use SOCR to compute the exact probability: P(X = 2). Approximate P(X = 2) using the binomial distribution. Is the approximation good? Why?
- Exercise 9: Do you think you can approximate well the hypergeometric probability distribution with
 , and number of "hot" items 40 using the binomial probability distribution? Explain.
- SOCR Home page: http://www.socr.ucla.edu
Translate this page:
