SOCR EduMaterials Activities FiniteOrderStatisticExperiment
From Socr
Contents |
Finite Order Statistic Experiment
Description
The experiment consists of selecting n balls at random (without replacement) from a population of m balls, numbered from 1 to N. For i = 1, 2, ..., n, the i'th smallest number in the sample, X(i) (the i'th order statistic), is recorded on each update. For a selected k, the distribution and moments of X(k) are shown in the distribution graph and the distribution table. The parameters m, n, and k can be varied with scroll bars
Goal
To provide a simulation of conditional probabilities with distribution tables and graphs. It allows the user to grasp the basic concepts of random events without replacement by illustrating the various outcomes with this simple demonstration.
Experiment
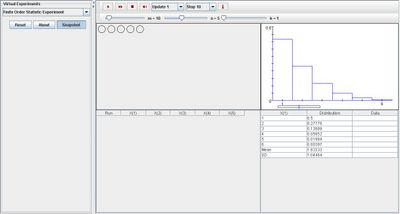
Go to the SOCR Experiment [[1]] and select the Finite Order Statistic Experiment from the drop-down list of experiments on the top left. The image below shows the initial view of this experiment:

When pressing the play button, one trial will be executed and recorded in the distribution table below. The fast forward button symbolizes the nth number of trials to be executed each time. The stop button ceases any activity and is helpful when the experimenter chooses “continuous,” indicating an infinite number of events. The fourth button will reset the entire experiment, deleting all previous information and data collected.
The “update” scroll indicates nth number of trials (1, 10, 100, or 1000) performed when selecting the fast forward button and the “stop” scroll indicates the maximum number of trials in the experiment.
Notice that initially, the distribution graph on the right is skewed right. This occurs because parameter k is set at a very low value. When k is set to a higher value, the graph is then skewed left.
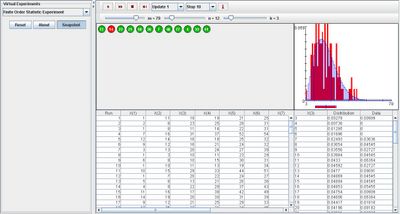
The image below displays an outcome of an experiment with the following conditions: large value of m, small value of n, and small value of k compared to n:

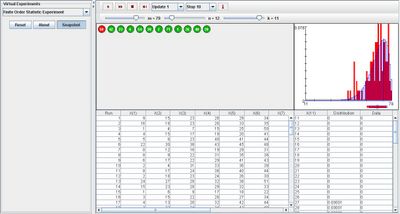
Varying parameter k shifts the distribution graph. Increasing it causes the graph to move to the right. As k reaches its highest value, the graph becomes skewed left. Similarly, decreasing k shifts the graph to the left and as k reaches its lowest value, the graph becomes skewed right. The image below demonstrates this property with k having a value near its maxima:

Note that parameter m can never be smaller than n since n is a sample from population m.
Applications
The Finite Order Experiment is an applet that generalizes the importance of experiments that consist of randomly selecting a sample from a population without replacement.
This applet may also be used in place of other activities that occur in daily lives:
Suppose car engineers are presented with a problem. One of the four cylinders in their enhanced vehicle continues to fail after driving over 1,000 miles. They run a test to determine which of the four cylinders is causing the problems in a sample size on 50. Using this applet may be a simple way to present their situation.
Another example may be a physician wants to determine whether his young patients are seriously ill or faking their illness to ditch school. His sample size is the number of young patients that visit him on week days. For those with mild symptoms, he prescribed Advil or a placebo. This applet may help demonstrate the outcomes of his experiment.
Translate this page:
