SOCR EduMaterials Activities More Examples
From Socr
Example 1:
From a large shipment of peaches, 12 are selected for quality control. Suppose that in this particular shipment only  of the peaches are unbruised. If among the 12 peaches 9 or more are unbruised the shipment is classified A. If between 5 and 8 are unbruised the shipment is classified B. If fewer than 5 are unbruised the shipment is classified C. Compute the probability that the shipment will be classified A, B, C.
We can use the formula and compute
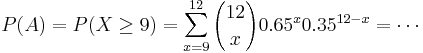
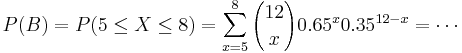
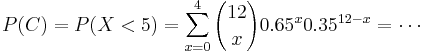
Or, much easier using SOCR...
Here is the distribution of the number of unbruised peaches among the 12 selected. After we enter n = 12 and p = 0.65 we get the distribution below:
\end{figure}
\noindent In the {\it Left Cut Off} and {\it Right Cut Off} boxes (left down corner of the applet) enter the numbers 5 and 8 respectively. What do you observe?
\begin{figure}[h] \includegraphics[height=2.6in, width=5.5in]{peaches2.jpg} \end{figure}
\noindent The distribution is divided into three parts. The left part (less than 5), the right part (above 8), and the between part (between 5 and 8 included). All the SOCR distributions applets are designed in the same way. From the applet the probabilities are $P(A)=0.346653, P(B)=0.627840, P(C)=0.025507$.</math>
