SOCR EduMaterials Activities NegativeBinomial Distributions
From Socr
This is an activity to explore the Negative Binomial Probability Distribution.
- Description: You can access the applets for the above distributions at http://www.socr.ucla.edu/htmls/SOCR_Distributions.html .
- Exercise 1: Use SOCR to graph and print the following distributions and comment on the shape of each one of them:
- a. X follows the negative binomial distribution with
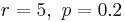 .
.
- b. X follows the negative binomial distribution with
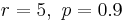 .
.
- c. X follows the negative binomial distribution with
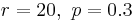 .
.
- d. X follows the negative binomial distribution with
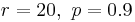 .
.
- a. X follows the negative binomial distribution with
- Exercise 2: Let X follows the negative binomial distribution with . Explain in words what P(X > 10) means and use SOCR to compute this probability.
Below you can see the distribution of negative binomial with  . In this graph you can also see the probability that the 5th success occurs on the 18th or 19th or 20th or 21st or 22nd trial.

- SOCR Home page: http://www.socr.ucla.edu
Translate this page:
