SOCR EduMaterials Activities Normal Distributions
From Socr
(Difference between revisions)
(→This is an activity to explore some continuous distributions and the normal approximation to binomial and Poisson.) |
|||
| Line 11: | Line 11: | ||
x_p=\frac{ln(1-\frac{p}{100})}{-\lambda} | x_p=\frac{ln(1-\frac{p}{100})}{-\lambda} | ||
</math> | </math> | ||
| - | **'''4.'' 'Compute one cumulative probability for each one of these distributions, show it on the graph, and verify it with the formula: | + | **'''4.''' Compute one cumulative probability for each one of these distributions, show it on the graph, and verify it with the formula: |
<math> | <math> | ||
P(X \le x)=1-e^{-\lambda x} | P(X \le x)=1-e^{-\lambda x} | ||
</math> | </math> | ||
| - | *'''Exercise 2:''' Use SOCR to graph and print the distribution of <math> X \sim N(20, 3) </ | + | *'''Exercise 2:''' Use SOCR to graph and print the distribution of <math> X \sim N(20, 3) </math>. Show on the graph the following points: <math>\mu \pm 1 \sigma, \mu \pm 2 \sigma, \mu \pm 3 \sigma </math>. How many standard deviations from the mean is the value <math> x=27.5 </math>? |
*'''Exercise 3:''' Graph the distribution of <math> X \sim N(40, 10) </math>. | *'''Exercise 3:''' Graph the distribution of <math> X \sim N(40, 10) </math>. | ||
**'''1.''' Find <math> P(X>49)</math> Submit a printout. | **'''1.''' Find <math> P(X>49)</math> Submit a printout. | ||
Revision as of 04:13, 25 November 2006
This is an activity to explore some continuous distributions and the normal approximation to binomial and Poisson.
- Description: You can access the applets for the above distributions at http://www.socr.ucla.edu/htmls/SOCR_Distributions.html .
- Exercise 1: \item[a.] Graph and print
 ,
,  ,
, 
- 1. Locate the maximum density for each one of these distributions.
- 2. Find the height of the density at 3 values of X (one near 0, one near the mean, and one towards the tail of the distribution).
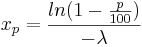
- 3. Find one percentile for each of these distributions and record them on the printouts. Verify these percentiles using the formula we discussed in class:
- 4. Compute one cumulative probability for each one of these distributions, show it on the graph, and verify it with the formula:
- Exercise 2: Use SOCR to graph and print the distribution of
 . Show on the graph the following points:
  . How many standard deviations from the mean is the value x = 27.5?
- Exercise 3: Graph the distribution of
 .
.
- 1. Find P(X > 49) Submit a printout.
- 2. Find P(X < 22) Submit a printout.
- 3. Find P(X < 58) Submit a printout.
- 4. Find P(X > 13) Submit a printout.
- 5. Find P(12 < X < 37) Submit a printout.
- 6. Find P(33 < X < 60) Submit a printout.
- 7. Find P(52 < X < 65) Submit a printout.
- 8. Use the mouse or the left cut off or right cut off points to find the 8th,20th,45th,55th$,$70th,95th percentiles. After you find these percentiles you can place by hand all of them in one printout (or you can submit a printout for each one of them if you want).
- 9. Make sure you know how to answer the above questions using the z score
 and your z table from the handout! You do not need to submit anything here.
- Exercise 3: The lifetime of tires of brand A follows the normal distribution with mean 40000 miles and standard deviation 4000 miles.
- 1. Use SOCR to find the probability that a tire will last between 40000 and 46000 miles.
- 2. Given that a tire will last more than 46000 miles what is the probability that it will last more than 50000 miles? Submit a printout and explain how you get the answer.
- 3. Given that a tire will last more than 46000 miles what is the probability that it will last less than 50000 miles? Submit a printout and explain how you get the answer.
- Exercise 4: The probability that a student is admitted in the Math Department Major at a college is <math.30 \%</math>. Suppose that this year 150 students will apply for admission into the Math major.
- 1. What is the distribution of the number of students admitted? Use $SOCR$ to graph and print this distribution. What is the shape of this distribution? What is the mean and standard deviation of this distribution?
- 2. Write an expression for the exact probability that among the 150 students at least 55 will be admitted.
- 3. Use SOCR to compute the probability of part (2).
- 4. Use the normal distribution to approximate the probability of part (2) (do not forget the continuity correction). What is the error of the approximation?
- Exercise 5: The number of pine trees per acre in a forest follows the Poisson distribution with mean 30.
- 1. Graph and print this distribution.
- 2. What is the shape of this distribution? Why?
- 3. Use SOCR to find the probability that an acre has more than 37 pines.
- 4. Approximate the probability of part (c) using the normal distribution.
Below you can see the distribution of a normal random variable X with 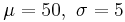 . In this graph you can also see the probability that X is between 53 and 60.

- SOCR Home page: http://www.socr.ucla.edu
Translate this page:
</math>
