SOCR EduMaterials Activities ProbabilityPlotExperiment
From Socr
Contents |
Probability Plot Experiment
Description
The experiment is to select a random sample of size n from a specified distribution and graphically test the data against a hypothesized parametric family of distributions. The sampling distribution can be chosen from the list box; the options are the normal, exponential, and uniform; in each case the appropriate parameters can be varied with scroll bars.
Similarly, the test distribution can be selected from a list box; the options are the standard normal distribution, the uniform distribution on (0, 1), or the exponential distribution with parameter 1.
The density function of the sampling distribution is shown in the first graph in blue, and on each update, the sample values are shown in red. The sample values are arranged in increasing order (these are the order statistics) and recorded in the first table on each update. The density function of the test distribution is shown in blue in the second graph. The quantities of order i/(n+1) for i=1, 2, ..., n are shown in red in the second graph and are recorded in the second table. On each update, the order statistic-quartile pairs are plotted in the third graph (this is the probability plot).
Goal
The purpose is to provide a simulation that provides data from a random sample that may demonstrate whether it could have come from a continuous distribution with a specific distribution function or not. With this applet, users should be able to explore the probability plots for the normal, exponential, and uniform distributions to develop enforce their understanding of these experiments.
Experiment
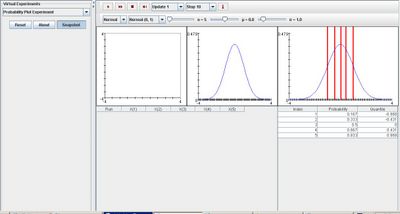
Go to the SOCR Experiment [[1]] and select the Probability Plot Experiment from the drop-down list of experiments on the top left. The image below shows the initial view of this experiment:

When pressing the play button, one trial will be executed and recorded in the distribution table below. The fast forward button symbolizes the nth number of trials to be executed each time. The stop button ceases any activity and is helpful when the experimenter chooses “continuous,” indicating an infinite number of events. The fourth button will reset the entire experiment, deleting all previous information and data collected.
The “update” scroll indicates nth number of trials (1, 10, 100, or 1000) performed when selecting the fast forward button and the “stop” scroll indicates the maximum number of trials in the experiment.
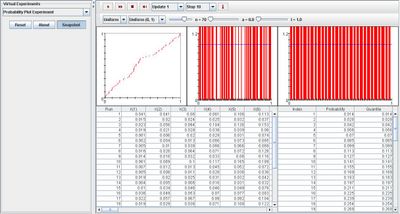
Initially, the experiment is set to normal sampling distribution with normal test distribution. Varying parameter n causes the quantities of order graph (red) to converge to the distribution graph (blue). The same outcome occurs under the two other types of test distribution, as well as all three test distributions when set to uniform sampling distribution. The image shown below demonstrates this property:

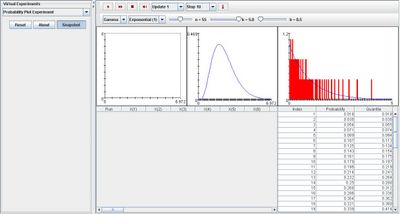
When the test distribution is set to Gamma, varying n also causes the quantities of order graph (red) to converge to the distribution graph (blue) in the far right. But when varying parameter k, the distribution graph in the middle becomes a curve skewed to the right with one peak. The image below demonstrates this:

Applications
The Probability Plot Experiment is an applet that attempts to fit the data to a parametric family of distributions as given in the list box: normal, uniform, or exponential. This simulation is very helpful when parameters are unknown and after using the goodness of fit test, it may be possible to estimate the parameters. This Java applet may be used in many different situations such as:
Suppose the probability of catching fish has normal distribution. On a given day, the sample size is 100 and fishermen make 50 attempts throughout the day. Using this applet will give the advantage of geometrically illustrating the probability plot.
Suppose the probability of bacteria population growth is exponential. The sample size is set to 20 million organisms and for each test distribution; there are 50 recordings of the population, each occurring every other day. Using this applet allow scientists to demonstrate their findings in a simple manner.
Translate this page:
