SOCR EduMaterials Activities RandomWalkExperiment
From Socr
Contents |
Random Walk Experiment
Description
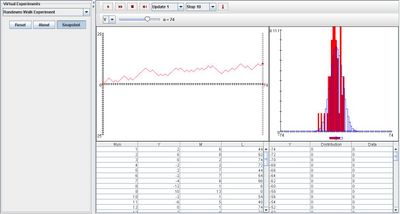
The experiment consists of tossing n fair coins. The position of the random walk after j tosses is the number of heads minus the number of tails. The random variables of interest are the final position, the maximum position, and the time of the last zero. The random walk is shown in red in the left graph on each update. The maximum and minimum values are shown as red dots on the right vertical axis; the last zero is shown as a red dot on the horizontal axis. The value of each of the three random variables is recorded in the first table on each update. Any of the three variables can be selected from the list box. The density and moments of the selected variable are shown in blue in the second graph and are recorded in the second table. On each update, the empirical density and moments are shown in red in the second graph and are recorded in the second table.
Goal
The main focus of this experiment is to give a simple simulation that demonstrates similarities with Bernoulli trials and the binomial distribution. It is also developed to better the understanding of a random variable with the probability of a success that is related to Markov Chains and Bernoulli trials.
Experiment
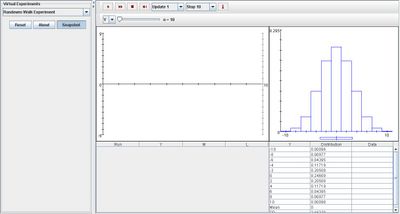
Go to the SOCR Experiment [[1]] and select the Random Walk Experiment from the drop-down list of experiments on the top left. The image below shows the initial view of this experiment:

When pressing the play button, one trial will be executed and recorded in the distribution table below. The fast forward button symbolizes the nth number of trials to be executed each time. The stop button ceases any activity and is helpful when the experimenter chooses “continuous,” indicating an infinite number of events. The fourth button will reset the entire experiment, deleting all previous information and data collected. The “update” scroll indicates nth number of trials (1, 10, 100, or 1000) performed when selecting the fast forward button and the “stop” scroll indicates the maximum number of trials in the experiment.
The sequence Y represents the final position of the random walk. As n increases, the distribution graph to the right takes on a more accurate shape of the normal curve. But notice that the graph does become narrower. The image shown below demonstrates this:

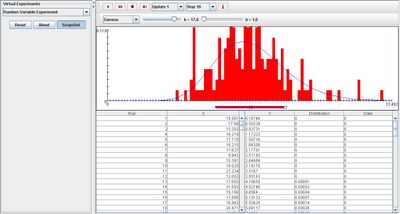
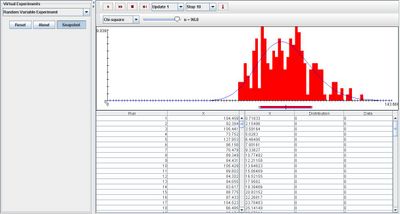
Similarly, sequence M and L experience the same effects when parameter n increases except that the graphs do not look normal. Instead, the distribution graphs become more accurate and defined in their own initial shapes. The images below demonstrate this property as the sequences are set to the maximum position and the last position to time zero, accordingly:


Applications
The Random Walk Experiment is a unique simulation in which it can illustrate data information of three specific categories. Although it is defined as an experiment dealing with the final, maximum, and last position before time zero, it may be used in other different types of events such as:
Taking on values dealing with discrete arcsine distributions, independence, symmetry, and Bernoulli trials
Translate this page:
