SOCR EduMaterials AnalysisActivities ANOVA 1
From Socr
(Difference between revisions)
m |
|||
| Line 3: | Line 3: | ||
== This SOCR Activity demonstrates the utilization of the SOCR Analyses package for statistical Computing. In particular, it shows how to use Analysis of Variance (ANOVA) and how to interpret the results == | == This SOCR Activity demonstrates the utilization of the SOCR Analyses package for statistical Computing. In particular, it shows how to use Analysis of Variance (ANOVA) and how to interpret the results == | ||
| - | * '''ANOVA Background''': | + | * '''ANOVA Background''': Analysis of variance (ANOVA) is a class of statistical analysis models and procedures, which compare means by splitting the overall observed variance into different parts. The initial techniques of the analysis of variance were pioneered by the statistician and geneticist R. A. Fisher in the 1920s and 1930s, and is sometimes known as Fisher's ANOVA or Fisher's analysis of variance, due to the use of Fisher's F-distribution as part of the test of statistical significance. [http://en.wikipedia.org/wiki/ANOVA | Read more about ANOVA]. |
| - | * '''SOCR ANOVA''': Go to SOCR [http://www.socr.ucla.edu/htmls/SOCR_Analyses.html Analyses] and select the the 0ne-way ANOVA tab from the right panel. <center>[[Image:SOCR_AnalysisActivities_ANOVA_Dinov_011707_Fig1.jpg|400px]]</center> | + | * '''SOCR ANOVA''': Go to SOCR [http://www.socr.ucla.edu/htmls/SOCR_Analyses.html Analyses] and select the the 0ne-way ANOVA tab from the drop-down list of SOCR analyses, in the left panel. There are three ways to enter data in the SOCR ANOVA applet |
| + | ** Click on the Example button on the top of the right panel. | ||
| + | ** Generate Random data by clicking on the Random Example button | ||
| + | ** Pasting your own data from a spreadsheet into SOCR ANOVA data table. | ||
| + | <center>[[Image:SOCR_AnalysisActivities_ANOVA_Dinov_011707_Fig1.jpg|400px]]</center> | ||
**Now, click the '''Raw Data''' check-box in the left panel, select '''Laplace Distribution''' (or any other distribution you want to sample from), choose the '''sample-size''' to be 100 (keep the center, Mu (<math>\mu=0</math>)) and click '''Sample'''. Then go to the '''Data''' tab, in the right panel. There you should see the 100 random Laplace observations stored as a column vector. | **Now, click the '''Raw Data''' check-box in the left panel, select '''Laplace Distribution''' (or any other distribution you want to sample from), choose the '''sample-size''' to be 100 (keep the center, Mu (<math>\mu=0</math>)) and click '''Sample'''. Then go to the '''Data''' tab, in the right panel. There you should see the 100 random Laplace observations stored as a column vector. | ||
** Next, go back to the '''Data Generation''' tab from the right panel and change the center of the Laplace distribution (set Mu=20, say). Click '''Sample''' again and you will see the list of randomly generated data in the '''Data''' tab expand to 200 (as you just sampled another set of 100 random Laplace observations). | ** Next, go back to the '''Data Generation''' tab from the right panel and change the center of the Laplace distribution (set Mu=20, say). Click '''Sample''' again and you will see the list of randomly generated data in the '''Data''' tab expand to 200 (as you just sampled another set of 100 random Laplace observations). | ||
Revision as of 21:29, 17 January 2007
SOCR Analysis Activities - SOCR Analysis of variance Activity
This SOCR Activity demonstrates the utilization of the SOCR Analyses package for statistical Computing. In particular, it shows how to use Analysis of Variance (ANOVA) and how to interpret the results
- ANOVA Background: Analysis of variance (ANOVA) is a class of statistical analysis models and procedures, which compare means by splitting the overall observed variance into different parts. The initial techniques of the analysis of variance were pioneered by the statistician and geneticist R. A. Fisher in the 1920s and 1930s, and is sometimes known as Fisher's ANOVA or Fisher's analysis of variance, due to the use of Fisher's F-distribution as part of the test of statistical significance. | Read more about ANOVA.
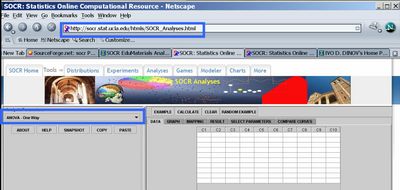
- SOCR ANOVA: Go to SOCR Analyses and select the the 0ne-way ANOVA tab from the drop-down list of SOCR analyses, in the left panel. There are three ways to enter data in the SOCR ANOVA applet
- Click on the Example button on the top of the right panel.
- Generate Random data by clicking on the Random Example button
- Pasting your own data from a spreadsheet into SOCR ANOVA data table.

- Now, click the Raw Data check-box in the left panel, select Laplace Distribution (or any other distribution you want to sample from), choose the sample-size to be 100 (keep the center, Mu (μ = 0)) and click Sample. Then go to the Data tab, in the right panel. There you should see the 100 random Laplace observations stored as a column vector.
- Next, go back to the Data Generation tab from the right panel and change the center of the Laplace distribution (set Mu=20, say). Click Sample again and you will see the list of randomly generated data in the Data tab expand to 200 (as you just sampled another set of 100 random Laplace observations).
- SOCR Home page: http://www.socr.ucla.edu
Translate this page:
