SOCR EduMaterials AnalysisActivities ANOVA 2
From Socr
SOCR Analyses Example on Two-Way Analysis of Variance
Background
2-Way Analysis of Variance (ANOVA) is a statistical technique for analyzing study designs with one numerical outcome (response/dependent) variable and two categorical explanatory (predictor/independent) variables. For instance, in a completely randomized design we want to compare the response/outcome of a test by various subject-demographics (e.g., age, gender, disease severity, etc.) Subjects are grouped by one demographic-factor and then randomly assigned one treatment-factor (hence two-way!)
The methodological details about the 2-Way ANOVA may be found at Wolfram Research, Wikipedia and elsewhere. A motivational example demonstrating the need and utilization of 2-Way designs and analyses can be found here.
2-way ANOVA is based on decomposing the variance of the response/dependent variable (total sum of squares) into within and between sum of squares. Sum of Squares between is then itself partitioned by intervention (blocking and interaction).
Typical hypotheses being tested in 2-way ANOVA are:
- Presense of significant main effects (within each of the 2 factors);
- Presense of an interaction between the two factors.
Examples
- Click on "Anova Two Way" at the left panel's combo box. And then, on the right panel, first click on "Example" and next click on "Data" to retreive the demonstrating example. The column Y is the response variable, which is treated as a quantitative variable. The columns I and J are the independent variables. (This example demonstrates a general two-way additive ANOVA model.)

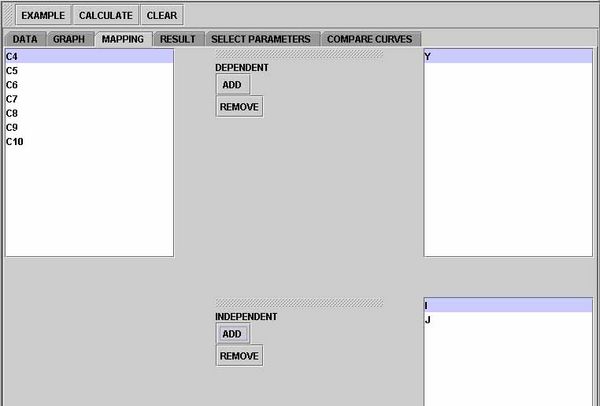
- Click on the "Mapping" button to get to the "Mapping" panel. Click on "Add" under Dependent to add Y, and click on "Add" under Independentto add I and J.

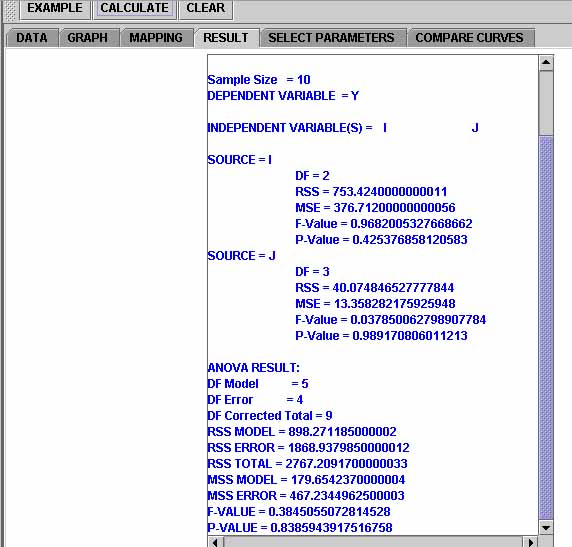
- Next, click on "Calculate" to let the computer do the calculation. Then click on "Result" to see the results.

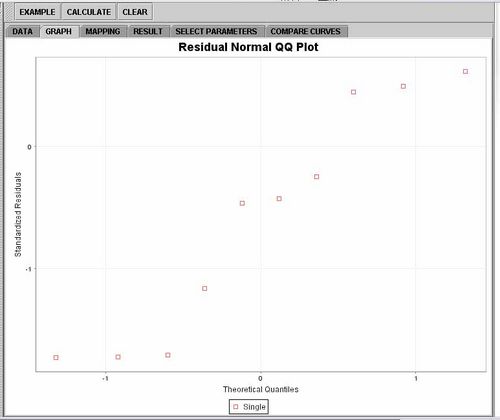
- Plots are available for vewing and checking regression dignostics. Click on "Graph" to see plots.

Translate this page:
