SOCR EduMaterials ModelerActivities MixtureModel 1
From Socr
(Difference between revisions)
m |
m |
||
| Line 4: | Line 4: | ||
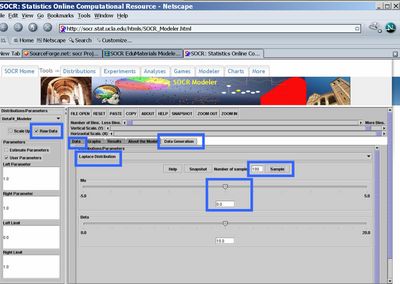
* '''Data Generation''': You typically have investigator-acquired data that you need to fit a model to. In this case we will generate the data by randomly sampling using the SOCR resource. Go to the SOCR [http://socr.stat.ucla.edu/htmls/SOCR_Modeler.html Modeler] and select the '''Data Generation''' tab from the right panel. | * '''Data Generation''': You typically have investigator-acquired data that you need to fit a model to. In this case we will generate the data by randomly sampling using the SOCR resource. Go to the SOCR [http://socr.stat.ucla.edu/htmls/SOCR_Modeler.html Modeler] and select the '''Data Generation''' tab from the right panel. | ||
| - | + | <center>[[Image:SOCR_ModelerActivities_MixtureModelFit_Dinov_011707_Fig2.jpg|400px]]</center> | |
| - | <center>[[Image:SOCR_ModelerActivities_MixtureModelFit_Dinov_011707_Fig2.jpg|400px]]</center> | + | |
| - | + | ||
**Now, click the '''Raw Data''' check-box in the left panel, select '''Laplace Distribution''' (or any other distribution you want to sample data from), choose the '''sample-size''' to be 100 (keep the center, mu, at zero) and click '''Sample'''. Then go to the '''Data''' tab, in the right panel. There you should see the 100 random Laplace observations stored as a column vector. | **Now, click the '''Raw Data''' check-box in the left panel, select '''Laplace Distribution''' (or any other distribution you want to sample data from), choose the '''sample-size''' to be 100 (keep the center, mu, at zero) and click '''Sample'''. Then go to the '''Data''' tab, in the right panel. There you should see the 100 random Laplace observations stored as a column vector. | ||
** Next, go back to the '''Data Generation''' tab from the right panel and change the center of the Laplace distribution (set Mu=20, say). Click '''Sample''' again and you will see the list of randomly generated data in the '''Data''' tab expand to 200 (as you sampled another set of 100 random Laplace observations). | ** Next, go back to the '''Data Generation''' tab from the right panel and change the center of the Laplace distribution (set Mu=20, say). Click '''Sample''' again and you will see the list of randomly generated data in the '''Data''' tab expand to 200 (as you sampled another set of 100 random Laplace observations). | ||
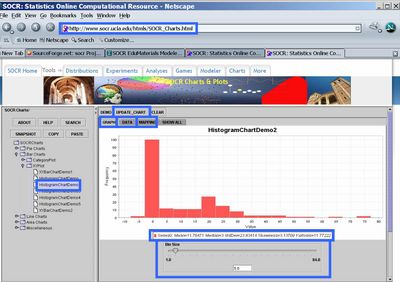
| + | * '''Exploratory Data Analysis (EDA)''': Go to the Data tab and select all observations in the data column (use CTR-A, or mouse-copy). Then open another web browser and go to SOCR [http://socr.stat.ucla.edu/htmls/SOCR_Charts.html Charts]. Choose '''HistogramChartDemo2''', say, clear the default data ('''Data''' tab) and paste in (CTR-V or mouse paste-in) the first column the 200 observations that you sampled in the SOCR Modeler Data Generator (above). Then you need to '''map''' the values - go to the '''Mapping''' tab, select the first column, where you pasted the data (C1), and click '''XValue'''. This will move the C1 column label from the right bin to the bottom-right bin. Finally, click '''Update Chart''' and go to the '''Graph''' tab to see your histogram of the 200 (bimodal) Laplace observations. Notice, that you can change the width of the histogram bin to clearly see the bi-modality of the distribution of these 200 measurements. Of course, this is due to the fact that we sampled from two distinct Laplace distributions, one with mean of zero and the second with mean of 20.0. | ||
| + | <center>[[Image:SOCR_ModelerActivities_MixtureModelFit_Dinov_011707_Fig3.jpg|400px]]</center> | ||
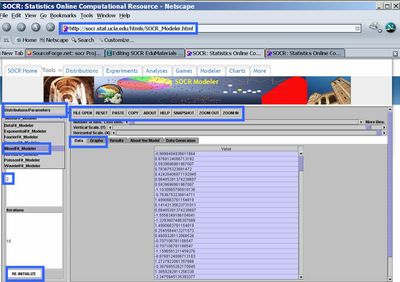
| - | * ''' | + | * '''Model Fitting''': Now go back to the SOCR [http://socr.stat.ucla.edu/htmls/SOCR_Modeler.html Modeler] browser (where you did the data sampling). Choose Mixed-Model-Fit from the drop-down list in the left panel. |
| - | + | <center>[[Image:SOCR_ModelerActivities_MixtureModelFit_Dinov_011707_Fig4.jpg|400px]]</center> | |
| - | <center>[[Image: | + | |
Revision as of 17:49, 17 January 2007
SOCR Modeler Activities - SOCR Mixture Model Fitting Activity
This is a SOCR Activity that demonstrates random sampling and fitting of mixture models to data
- Data Generation: You typically have investigator-acquired data that you need to fit a model to. In this case we will generate the data by randomly sampling using the SOCR resource. Go to the SOCR Modeler and select the Data Generation tab from the right panel.

- Now, click the Raw Data check-box in the left panel, select Laplace Distribution (or any other distribution you want to sample data from), choose the sample-size to be 100 (keep the center, mu, at zero) and click Sample. Then go to the Data tab, in the right panel. There you should see the 100 random Laplace observations stored as a column vector.
- Next, go back to the Data Generation tab from the right panel and change the center of the Laplace distribution (set Mu=20, say). Click Sample again and you will see the list of randomly generated data in the Data tab expand to 200 (as you sampled another set of 100 random Laplace observations).
- Exploratory Data Analysis (EDA): Go to the Data tab and select all observations in the data column (use CTR-A, or mouse-copy). Then open another web browser and go to SOCR Charts. Choose HistogramChartDemo2, say, clear the default data (Data tab) and paste in (CTR-V or mouse paste-in) the first column the 200 observations that you sampled in the SOCR Modeler Data Generator (above). Then you need to map the values - go to the Mapping tab, select the first column, where you pasted the data (C1), and click XValue. This will move the C1 column label from the right bin to the bottom-right bin. Finally, click Update Chart and go to the Graph tab to see your histogram of the 200 (bimodal) Laplace observations. Notice, that you can change the width of the histogram bin to clearly see the bi-modality of the distribution of these 200 measurements. Of course, this is due to the fact that we sampled from two distinct Laplace distributions, one with mean of zero and the second with mean of 20.0.

- Model Fitting: Now go back to the SOCR Modeler browser (where you did the data sampling). Choose Mixed-Model-Fit from the drop-down list in the left panel.

- SOCR Home page: http://www.socr.ucla.edu
Translate this page:
