SOCR Events May2008 C7 S1
From Socr
SOCR May 2008 Event - Use percentiles and measures of variability to analyze data
Compute different measures of spread, including the range, standard deviation, and interquartile range
Compare the effectiveness of different measures of spread, including the range, standard deviation, and interquartile range in specific situations
Use percentiles to summarize the distribution of a numerical variable
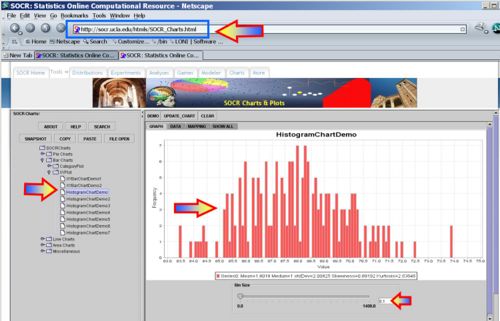
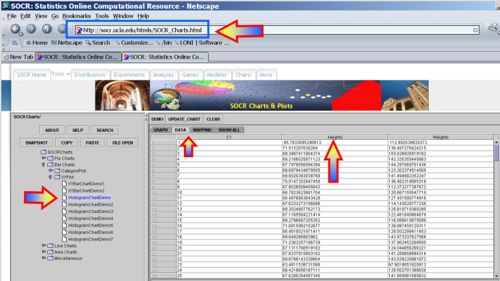
Copy the first 200 measurements of the Human Height and Weight Dataset into the SOCR Histogram Chart, map the Heights column and choose the bin-size to be 0.1 - this corresponds roughly to plotting the percentiles for this data.


Use histograms to obtain percentiles
References
- Utah Secondary Core Curriculum Standards for Statistics
- Interactive Statistics Education EBook
- SOCR Home page: http://www.socr.ucla.edu
Translate this page:
