SOCR EduMaterials Activities DiceExperiment
From Socr
Contents |
Dice Experiment
Description
The experiment consists of rolling n dice, each governed by the same probability distribution. You can specify the die distribution by clicking on the die probability button; this button bring up the die probability dialog box. You can define your own distribution by typing probabilities into the text fields of the dialog box, or you can click on one of the buttons in the dialog box to specify one of the following special distributions: fair, 1-6 flat 2-5 flat 3-4 flat skewed left skewed right
The following random variables are recorded on each update: the sum of the scores Y the average score M the minimum score U the maximum score V the number of aces (1's) Z
Any one of these variables can be selected with a list box. The density and moments of the selected variable are shown in blue in the distribution graph and are recorded in the distribution table. When the simulation runs, the empirical density and moments are shown in red in the distribution graph and are recorded in the distribution table. The parameter n can be varied with a scroll bar.
Goal
To provide a simulation demonstrating events of discrete variables and resemblance to the “bell shaped curve” of the Central Limit Theorem. Using this applet should allow the user to gain a better understanding of experimenting with distinct variables.
Experiment
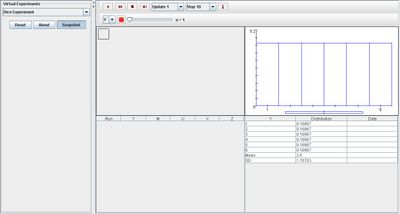
Go to the SOCR Experiments and select the Dice Experiment from the drop-down list of experiments on the top left. The image below shows the initial view of this experiment:

When pressing the play button, one trial will be executed and recorded in the distribution table below. The fast forward button symbolizes the nth number of trials to be executed each time. The stop button ceases any activity and is helpful when the experimenter chooses “continuous,” indicating an infinite number of events. The fourth button will reset the entire experiment, deleting all previous information and data collected. The “update” scroll indicates nth number of trials (1, 10, 100, or 1000) performed when selecting the fast forward button and the “stop” scroll indicates the maximum number of trials in the experiment.
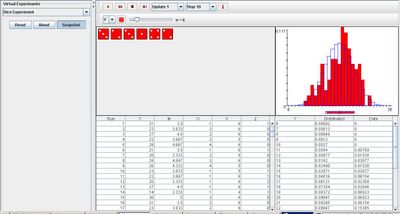
As parameter n increases, the distribution graph will have a “bell shaped curve” for variable Y and M. Similarly, when variable U and V are selected, the distribution graph will become more skewed to the right and left, respectively. For variable Z, it will also be skewed to the right but it also slightly takes form of the “bell shaped curve.” The image below demonstrates this property of the java applet when selecting variable Y after many trials:
Note that the empirical density and moments graph begin to converge to the distribution graph after every trial.

Applications
The Dice Experiment is an applet that generalizes the important of experiments involving discrete variables. It allows users to understand the different outcomes when drawing the selected random variables, whether it is the sum of the scores, the average score, etc.
This applet may also be used in place of other activities that occur in daily lives:
Suppose a gambler wants to test his luck in a casino. He uses this applet to show the actually likelihood of randomly tossing two dice and having their sum equal to 7. With the selection of variable Y, he sees that he has a higher chance of landing with the sum of 7 than most of the other numbers.
For example, researchers want to know which color of the rainbow attracts toddlers the most so that they can develop a product that will be successful. They hypothesize the color yellow to be the best candidate. With this applet, they select variable Z to represent the number of toddlers choosing yellow.
Translate this page:
