SOCR EduMaterials FunctorActivities Bernoulli Distributions
From Socr
(Difference between revisions)
m (→See also) |
|||
| (10 intermediate revisions not shown) | |||
| Line 3: | Line 3: | ||
* '''Description''': You can access the applets for the above distributions at http://www.socr.ucla.edu/htmls/SOCR_DistributionFunctors.html . | * '''Description''': You can access the applets for the above distributions at http://www.socr.ucla.edu/htmls/SOCR_DistributionFunctors.html . | ||
| - | * '''Exercise 1:''' Use SOCR to graph the | + | * '''Exercise 1:''' Use SOCR to graph the MGF's and print the following distributions and answer the questions below. Also, comment on the shape of each one of these distributions: |
**a.<math> X \sim Bernoulli(0.5) </math> | **a.<math> X \sim Bernoulli(0.5) </math> | ||
| - | **b.<math> | + | **b.<math> X \sim Binomial(1,0.5) </math> |
| - | **c.<math> | + | **c.<math> X \sim Geometric(0.5) </math> |
| - | **d.<math> | + | **d.<math> X \sim NegativeBinomial(1, 0.5) </math> |
| + | |||
| + | Below you can see a snapshot of the MGF of the distribution of <math> X \sim Bernoulli(0.8) </math> | ||
| + | <center>[[Image:BernoulliMGF.jpg|600px]]</center> | ||
| + | |||
| + | Do you notice any similarities between the graphs of these MGF's between any of these distributions? | ||
| + | |||
| + | * '''Exercise 2:''' Use SOCR to graph and print the MGF of the distribution of a geometric random variable with <math> p=0.2, p=0.7 </math>. What is the shape of this function? What happens when <math> p </math> is large? What happens when <math> p </math> is small? | ||
| + | |||
| + | * '''Exercise 3:''' You learned in class about the properties of MGF's If <math> X_1, ...X_n</math> are iid. and <math>Y = \sum_{i=1}^n X_i. </math> then <math>M_{y}(t) = {[M_{X_1}(t)]}^n</math>. | ||
| + | **a. Show that the MGF of the sum of <math>n</math> independent Bernoulli Trials with success probability <math> p </math> is the same as the MGF of the Binomial Distribution using the corollary above. | ||
| + | **b. Show that the MGF of the sum of <math>n</math> independent Geometric Random Variables with success probability <math> p </math> is the same as the MGF of the Negative-Binomial Distribution using the corollary above. | ||
| + | **c. How does this relate to Exercise 1? Does having the same MGF mean they are distributed the same? | ||
| + | |||
| + | * '''Exercise 4:''' Graph the PDF and the MGF for the appropriate Distribution where <math> M_x(t)={({3 \over 4}e^t+{1\over 4})}^{15} </math>. Be sure to include the correct parameters for this distribution, for example if <math> X \sim Geometric(p) </math> be sure to include the numeric value for <math>p</math> | ||
| + | |||
| + | ==See also== | ||
| + | * [[SOCR_EduMaterials_FunctorActivities_MGF | Other SOCR Distribution Functor Activities]] | ||
| + | |||
| + | <hr> | ||
| + | * SOCR Home page: http://www.socr.ucla.edu | ||
| + | |||
| + | {{translate|pageName=http://wiki.stat.ucla.edu/socr/index.php?title=SOCR_EduMaterials_FunctorActivities_Bernoulli_Distributions}} | ||
Current revision as of 06:22, 9 January 2008
This is an activity to explore the Moment Generating Functions for the Bernoulli, Binomial, Geometric and Negative-Binomial Distributions.
- Description: You can access the applets for the above distributions at http://www.socr.ucla.edu/htmls/SOCR_DistributionFunctors.html .
- Exercise 1: Use SOCR to graph the MGF's and print the following distributions and answer the questions below. Also, comment on the shape of each one of these distributions:
- a.
- b.
- c.
- d.

- a.
Below you can see a snapshot of the MGF of the distribution of 

Do you notice any similarities between the graphs of these MGF's between any of these distributions?
- Exercise 2: Use SOCR to graph and print the MGF of the distribution of a geometric random variable with p = 0.2,p = 0.7. What is the shape of this function? What happens when p is large? What happens when p is small?
- Exercise 3: You learned in class about the properties of MGF's If X1,...Xn are iid. and
 then
then ![M_{y}(t) = {[M_{X_1}(t)]}^n](/socr/uploads/math/2/1/7/217410c286efabe001a50f7198167f5d.png) .
.
- a. Show that the MGF of the sum of n independent Bernoulli Trials with success probability p is the same as the MGF of the Binomial Distribution using the corollary above.
- b. Show that the MGF of the sum of n independent Geometric Random Variables with success probability p is the same as the MGF of the Negative-Binomial Distribution using the corollary above.
- c. How does this relate to Exercise 1? Does having the same MGF mean they are distributed the same?
- Exercise 4: Graph the PDF and the MGF for the appropriate Distribution where
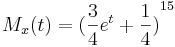 . Be sure to include the correct parameters for this distribution, for example if
  be sure to include the numeric value for p
See also
- SOCR Home page: http://www.socr.ucla.edu
Translate this page:
