SOCR EduMaterials Activities BubbleChart
From Socr
(→Description) |
(→Description) |
||
| Line 7: | Line 7: | ||
== Description == | == Description == | ||
| - | Go to the SOCR Charts and select Miscellaneous from the items located on the left, then select Bubble Chart Demo: | + | Go to the [http://socr.ucla.edu/htmls/SOCR_Charts.html SOCR Charts] and select Miscellaneous from the items located on the left, then select Bubble Chart Demo: |
<center>[[Image:SOCR_Activitites_Miscellaneous_BubbleChart_Chui_090507_Fig1.jpg|400px]]</center> | <center>[[Image:SOCR_Activitites_Miscellaneous_BubbleChart_Chui_090507_Fig1.jpg|400px]]</center> | ||
Revision as of 21:40, 5 September 2007
Contents |
BUBBLE CHART
Background
Bubble Charts is a process to illustrate three dimensional data in a two dimensional charts. The size of the market is proportional to a third set of values on a grid according to the standard X and Y values. It is useful for data set of hundreds to thousands of values.
Description
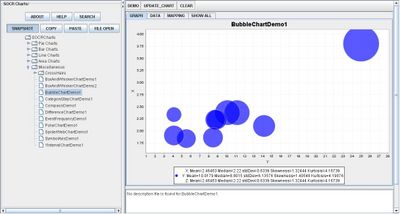
Go to the SOCR Charts and select Miscellaneous from the items located on the left, then select Bubble Chart Demo:

Note that below the graph shows the numerical values for mean, standard deviation, and median.
Applications
One of the most persuasive elements when proposing data and literature to others is a well-designed chart presentation.
The Bubble Chart is useful for large sets of values so scientists may use this type of chart when presenting a simple display of red blood cell counts in different ages of humans.
Bubble Charts may also be used for researchers who study the population of ants in different parts of the state, country, continent, or world.
Translate this page:
